Figure 6.
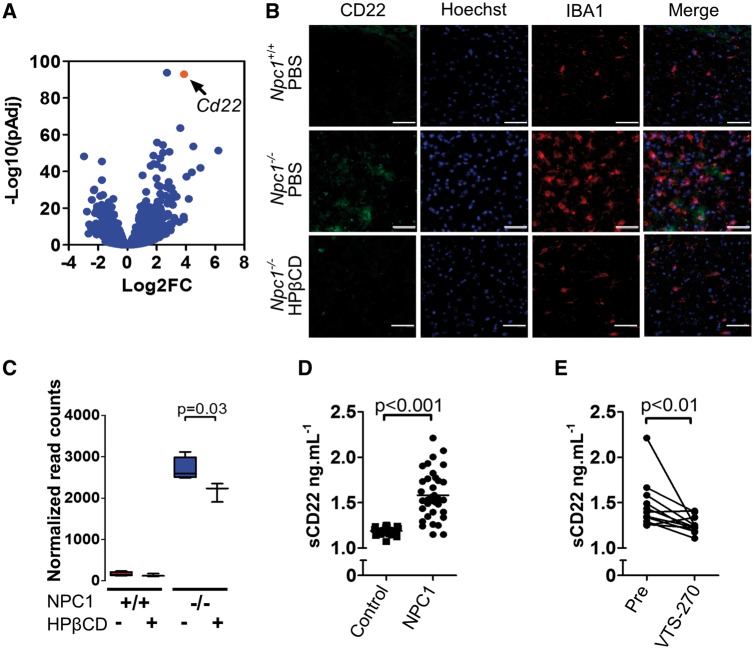
Characterization of CD22 expression as a biomarker for microglial activation in NPC1. (A) Volcano plot analysis of our transcriptome data. Y axis is the −Log10 transformation of the P adjusted value and the X axis is the Log2 fold change in expression in Npc1−/− relative to Npc1+/+ microglia. (B) CD22 (green) and IBA1 (red) double immunofluorescence staining of thalamic tissue from 7-week-old Npc1+/+ and Npc1−/− mice treated with either PBS or HPβCD. Scale bar is 50 µm. (C) Normalized mRNA expression read counts for Cd22 in 7-week-old microglia from Npc1+/+ and Npc1−/− mice treated with PBS (-) or HPβCD (+). Data are from n=5. (D) ELISA quantification of soluble CD22 (sCD22) in human cerebrospinal fluid (CSF) from NPC1 patients (1.58±0.26, n=18) and age similar control samples (1.18±0.01; n =10). (E) CSF sCD22 levels decrease toward normal in 11 NPC1 patients after 18 months of intrathecal VTS-270 (HPβCD) treatment. *P<0.01, Wilcoxon paired test.

