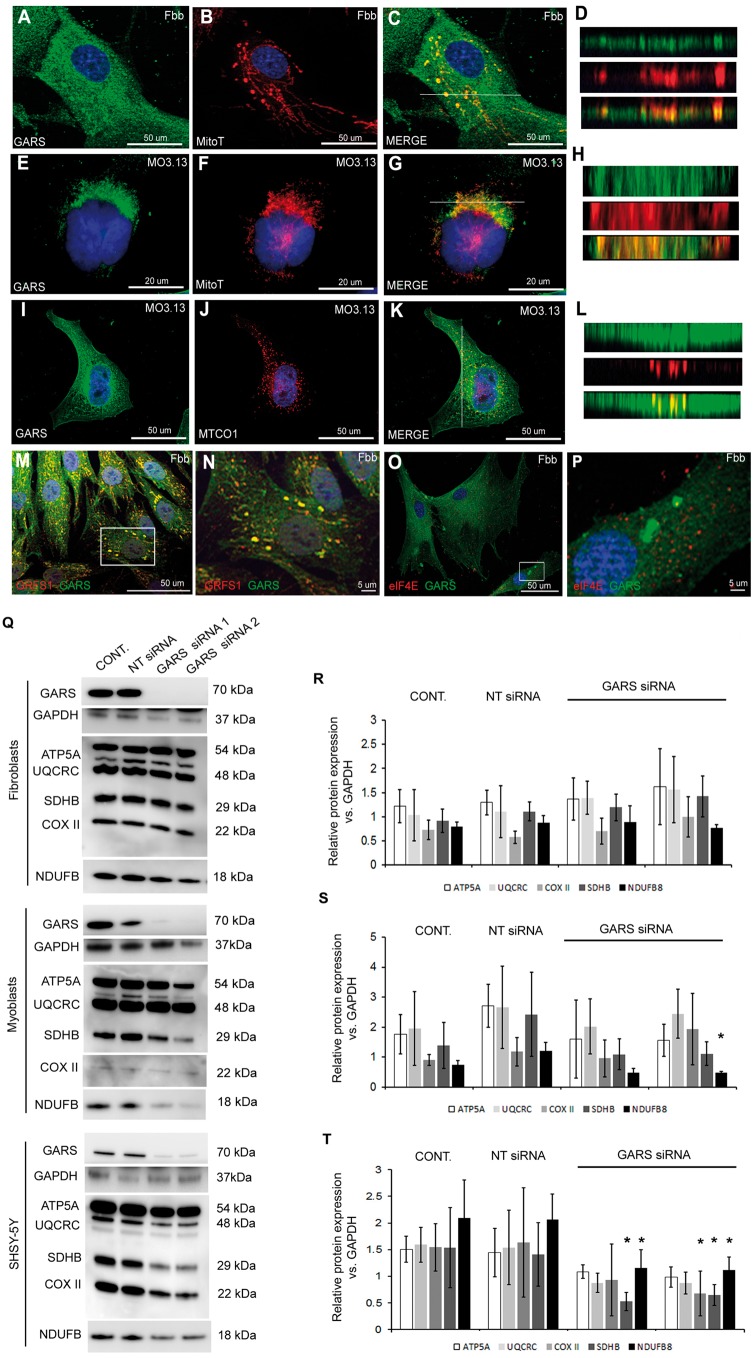
Figure 2.
Endogenous GARS downregulation in human cells. (A) Human control fibroblasts and (E, I) MO3.13 cells were immunostained for GARS (green) and mitochondria (Mitotracker, red) (B, F, J). Merged images are shown in (C, G, K). White lines indicates the location of the XY slice. Representative XY sections show co-localization of GARS with mitochondria (Mitotracker) in fibroblasts (D) MO3.13 cells (H) and GARS-MTCO1 (red) co-localization in MO3.13 cells (L). Staining for the mitochondrial RNA granule marker GRFS1 (red) and GARS (green) in fibroblasts (M). Boxed area is shown as zoomed image (N). Staining for cytosolic RNA granule marker eIF4E (red) and GARS (green) in fibroblasts (O). Boxed area is shown as zoomed image (Q). Human fibroblasts, myoblasts and SHSY-5Y cells were subjected to siRNA mediated GARS downregulation. Cells were transfected with non-targeting (NT) siRNA, and two different GARS siRNAs (GARS siRNA 1 and 2) for 9 days. After 9 days of treatment total cell lysates were collected from the cells. The silencing of GARS protein and the steady-state level of mitochondrial proteins were determined by western blots. GAPDH was used as loading control (R, S, T). Bar graph indicates the level of mitochondrial proteins in un-transfected (control), NT siRNA transfected and GARS siRNA treated fibroblasts (R), myoblast (S) and SHSY-5Y cells (T). Error bars show standard deviation. Three independent experiments were performed. One-way ANOVA followed by Bonferroni post-hoc test (with 97% confidence intervals) were used in comparing the level of protein expression (*P < 0.5 versus cont. and non-targeted samples).

