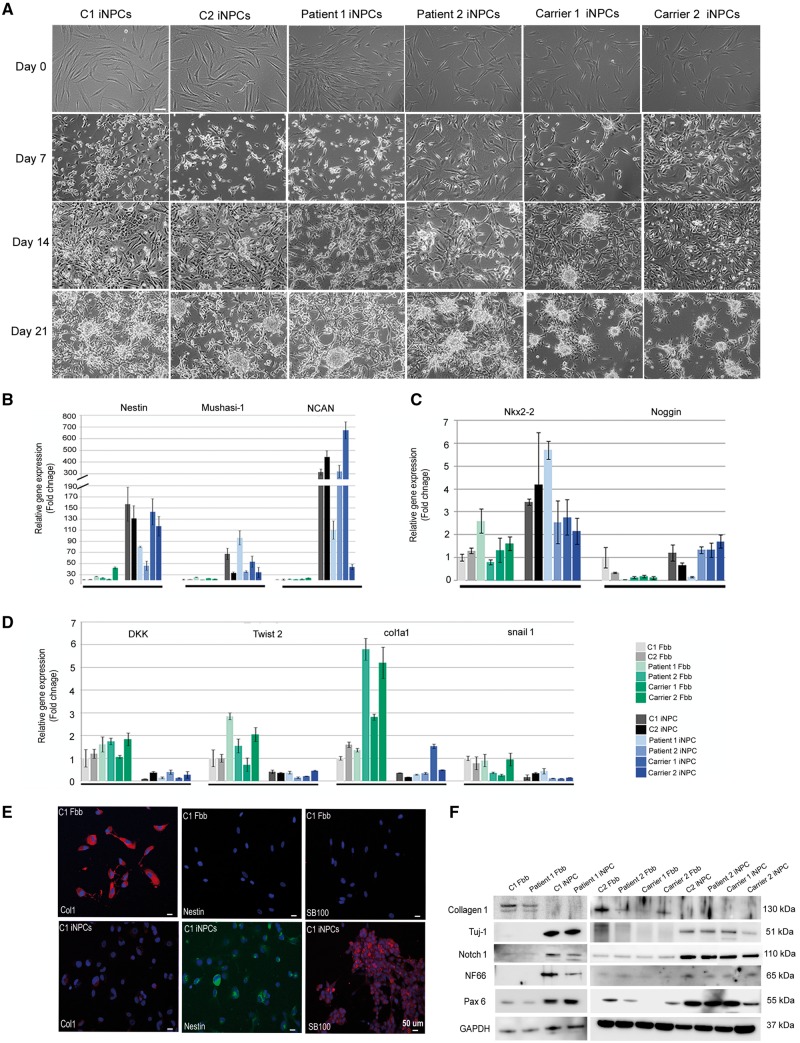
Figure 3.
Characterization of iNPCs. (A) Phase-contrast images show the conversion process from the initial fibroblasts to iNPC cultures. Morphological changes were apparent after 7 days of transfection. Cells began to form sphere-like structures at 21 days. Scale bars, 50 µm. iNPCs and primary fibroblasts were collected and subjected to total RNA extraction and real-time PCR analysis. (B, C) iNPC markers (Nestin, Mushashi-1, Noggin, Ncan and Nkx2-2) demonstrated significantly higher expression levels, suggesting neuronal fate, and (D) reduced expression of fibroblast markers (Dkk1, Twist2, Col1a1 and Snail1) indicated loss of fibroblast characteristics (n = 3 independent experiment). Error bars represent standard deviation. (E) Immunofluorescence staining of fibroblasts and iNPC cultures at day 20 reveals loss of Collagen I (fibroblast marker) and increased expression of the iNPC markers Nestin and SB100 in the iNPCs (bottom row). DAPI was used to visualise nuclei. Scale bars, 20 µm. (F) Protein levels of iNPC marker proteins (Tuj-1, Notch1, NF66, PAX6) demonstrated higher levels in the iNPCs confirming the neuronal fate. GAPDH was used as loading control.

