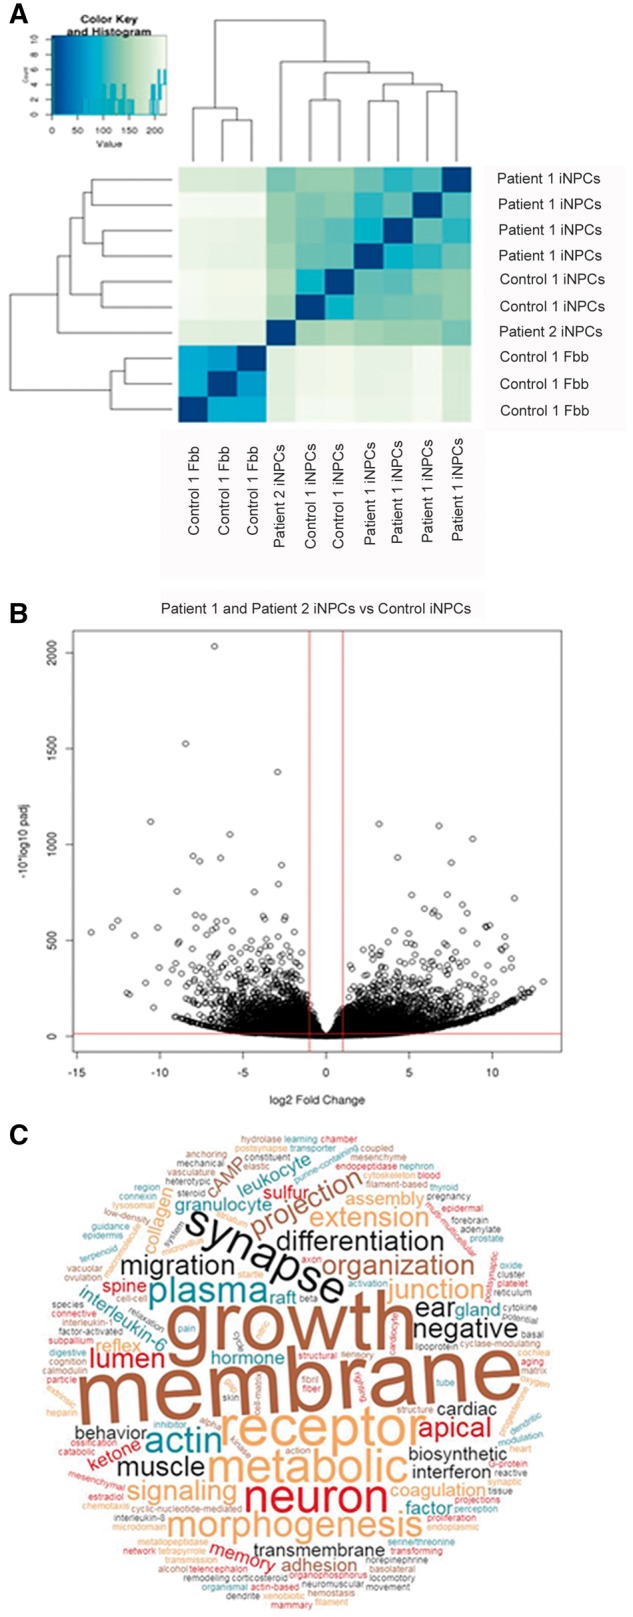
Figure 4.

RNAseq analysis of patient and control iNPS, and control fibroblasts. (A) Heat map showing hierarchical clustering of the RNAseq read count sample distance matrix demonstrating the dissimilarity between the RNA sequencing expression profiles of the control fibroblasts versus the iNPCs (control and patient) (B) Volcano plot of −log10 adjusted P-value versus the log 2 fold change in RNA expression of iNPCs cells compared to fibroblasts, again demonstrating the large number of RNAs showing differential expression between the iNPCs and fibroblasts. (C) Word Cloud of GO terms that were significantly enriched for genes showing significant up-/down-regulation of RNAs in both patients’ iNPC cells versus control iNPC cells.
