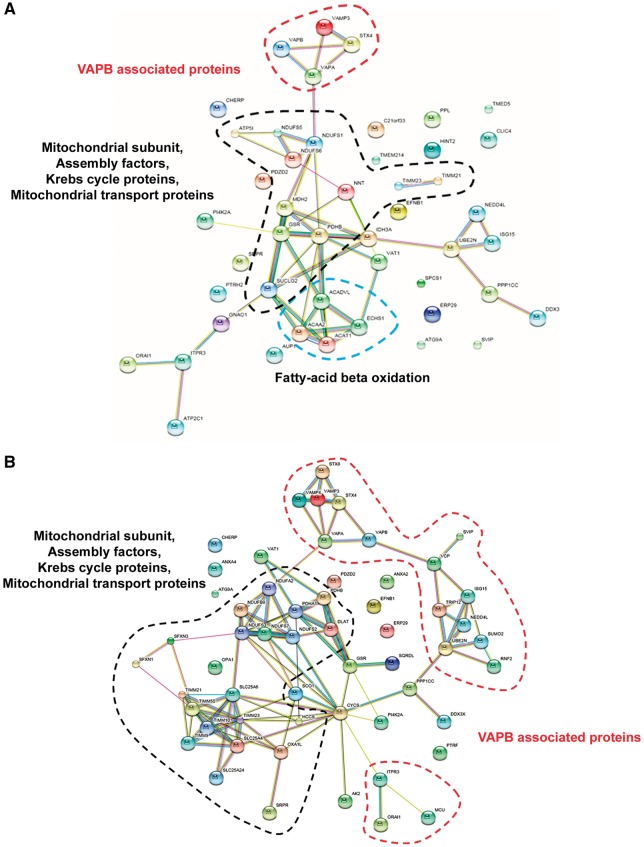
Figure 8.
Differentially regulated mitochondrial proteins identified in patient iNPCs. Comparative proteomic analysis of mitochondrial proteins was performed on three iNPC cells lines (patient 1, patient 2 and control). A total of 85 differentially expressed mitochondrial proteins were identified in comparison between control and patient groups. Screen shot of the STRING (Search Tool for the Retrieval of Interacting Proteins) showed a network of differentially expressed proteins in cells of patient 2 (A) and patient 1. (B) Black circles indicated protein clusters directly affecting mitochondrial function. Red circles represent protein clusters related to vesicle-associated membrane proteins and its downstream pathways. Blue circle represents fatty acid oxidation pathway. The interactions are shown in confidence view. Thicker lines represent a stronger association. The proteins are identified by their gene names located near each sphere.

