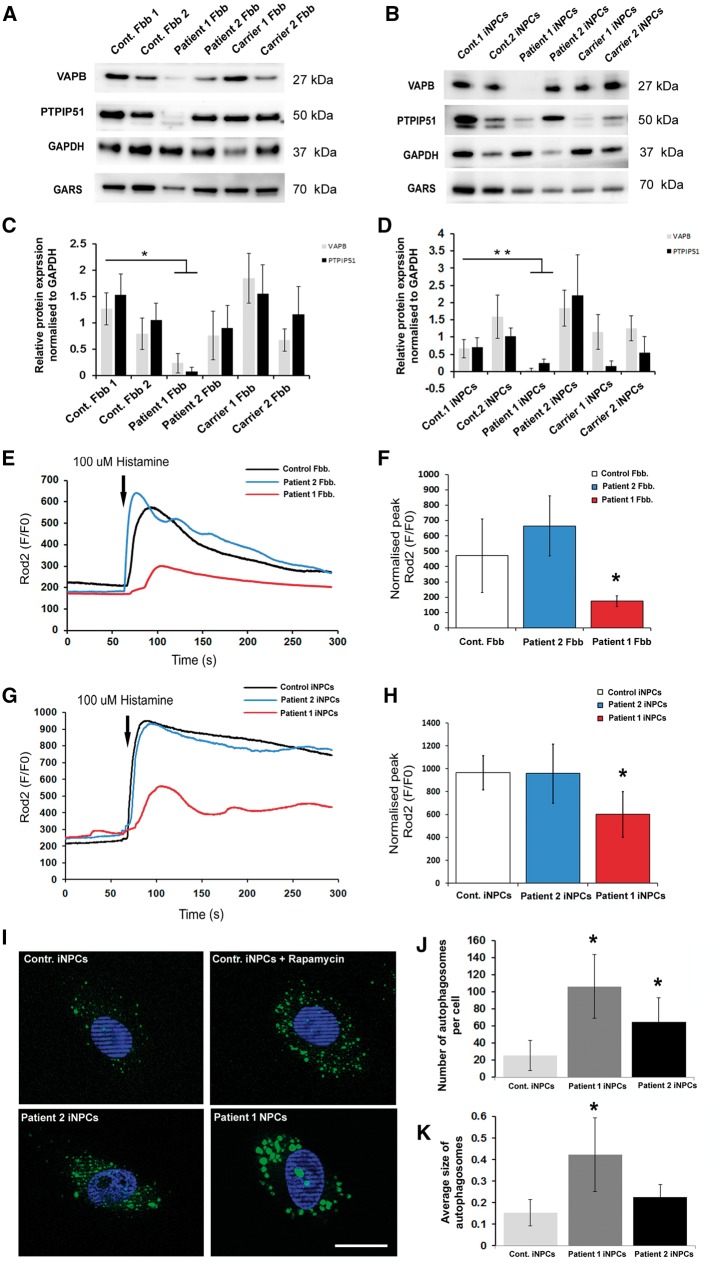
Figure 9.
Western blot analysis and Ca2+ measurement in control and patient cell lines. (A, B). Total protein lysate from control and patient fibroblasts and iNPCs cells were analysed by immunoblotting using VAPB, PTPIP51, GAPDH and GARS antibodies. Representative blots from three independent experiments are shown. (C, D) Bars represent the average protein expression levels normalized to GAPDH obtained by densitometry analysis. Error bars show standard deviation, **P < 0.005, *P < 0.05. Data were analysed with paired t-test on Sigma plot (version 11.0) where samples represents n = 3 (experimental replicates). Mitochondrial Ca2+ transients in fibroblasts (E) and iNPCS cells (G) are shown. Mitochondrial Ca2+ transients were induced by cell stimulation with 100 μm histamine. The traces are representative of at least 10 independent experiments. Bars indicate the average heights of peak values (F, H). Results are the mean ± Standard deviation *P < 0.05. Data were analysed with unpaired t-test on Sigma plot (version 11.0) where samples represent n = 10 (experimental replicates). The P-values are from an unpaired t-test, *P < 0.05. Cell line of patient 1 harbouring the dominant GARS mutation increased the number and size of the autophagic structures. Representative images of cells are shown with DAPI-labelled nuclei. Scale bars are 10 um (I). Bar charts show quantification of autophagosomes (dots/cell) (J) and average size of the autophagic structures (K). n = 30–50 cells per condition in three independent experiments. Data were analysed by one-way ANOVA and Dunn’s method. Error bars are standard deviation *P < 0.05.

