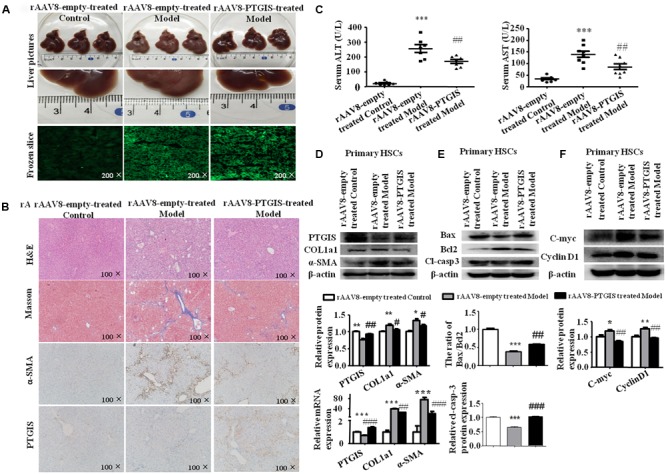
FIGURE 5.

Liver-specific PTGIS overexpression alleviated CCl4-induced liver fibrosis. (A) Macroscopic examination of fresh liver tissue without fixation from C57BL/6J mice in rAAV8-empty-treated control group, rAAV8-empty-treated model group and rAAV8-PTGIS-treated model group, and the transduction efficient of rAAV8-PTGIS-eGFP in liver tissues were examinated by laser confocal microscopy. (B) Pathology observation of the mouse liver sections stained with H&E staining, masson staining (200 μM), immunohistochemistry (IHC) for α-SMA (200 μM) and PTGIS (200 μM). (C) Serum ALT and AST levels, ∗∗∗P < 0.001 vs. rAAV8-empty treated Control group, ##p < 0.01 vs. rAAV8-empty treated Model group. (D) The protein and mRNA expression levels of PTGIS, COL1a1, α-SMA were examinated by western blot and RT-qPCR analysis, ∗P < 0.05, ∗∗P < 0.01 vs. rAAV8-empty treated Control group, #p < 0.05, ##p < 0.01 vs. rAAV8-empty treated Model group. (E) the protein levels of Bax, Bcl2, and Cleaved-caspase3 were assessed by western blot experiment, ∗∗∗P < 0.001 vs. rAAV8-empty treated Control group, ##p < 0.01, ###p < 0.001 vs. rAAV8-empty treated Model group. (F) The protein levels of C-myc and CyclinD1 were detected by western blot analysis, ∗P < 0.05 vs. rAAV8-empty treated Control group, #p < 0.05 vs. rAAV8-empty treated Model group.
