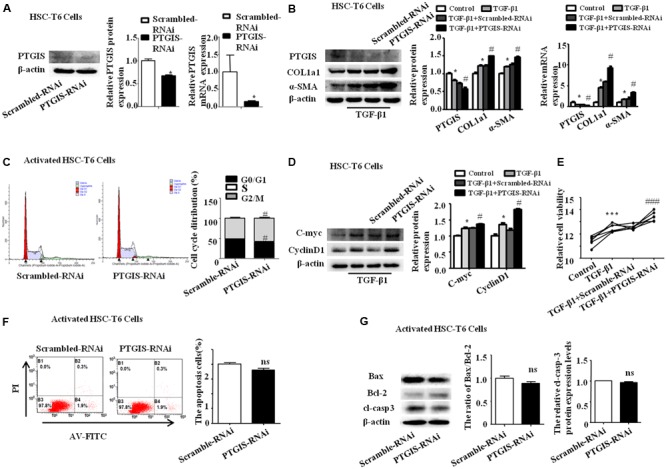
FIGURE 7.

Influence of loss-expression of PTGIS in TGF-β1-treated HSC-T6 cells. (A) The efficiency of PTGIS lose-expression in HSC-T6 cells were detected by western blot and RT-qPCR. ∗p < 0.05 vs. control group. (B) The PTGIS, COL1a1 and α-SMA protein and mRNA expression levels in PTGIS-RNAi-transfected HSC-T6 cells were detected by western blot and RT-qPCR experiments. ∗P < 0.05 vs. control group, #P < 0.05 vs. TGF-β1 + Scrambled-RNAi group. (C) The cell cycle of PTGIS-RNAi transfected HSC-T6 cells, #P < 0.05 vs. TGF-β1 + Scrambled-RNAi transfected group in TGF-β1 activated HSC-T6 cells. (D) The protein and mRNA levels of Cmyc and Cyclin D1 were detected by western blot analysis, ∗P < 0.05 vs. control group, #p < 0.05 vs. Scrambled-RNAi transfected group in activated HSC-T6 cells. (E) The relative cell viability of HSC-T6 cells were measured by CCK8 analysis, ∗∗∗P < 0.001 vs. control group, ###p < 0.001 vs. TGF-β1 + Scrambled-RNAi transfected group. (F) FACS analysis were used to examined apoptosis rate alteration in HSC-T6 cells from Scrambled-RNAi transfected group and PTGIS-RNAi transfected group in TGF-β1 activated HSC-T6 cells, ###p < 0.001 vs. TGF-β1 + Scrambled-RNAi transfected group. (G) The apoptosis-associated proteins (Bax, Bcl2, cleaved-casepase3) were detected by western blot analysis, ##p < 0.01, ###p < 0.001 vs. Scrambled-RNAi transfected group in activated HSC-T6 cells.
