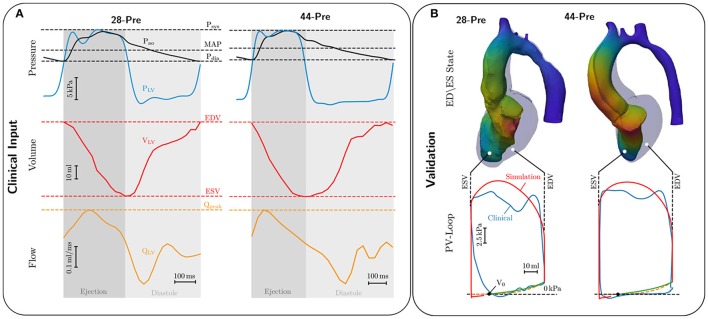
Figure 3.
(A) Invasive clinical recordings from cases 28-Pre and 44-Pre. Top: Recorded aortic pressure Pao (black curve) and recorded LV pressure PLV (blue curve). Marked with dashed lines are Systolic pressure Psys, mean arterial pressure MAP, and diastolic pressure Pdia; Center: Volume change in the LV, VLV, in red ranging from end-diastolic volume EDV to end-systolic volume ESV. Bottom: LV flow QLV in orange with marked peak flow Qpeak. (B) Comparison of EM simulations and clinical data. Upper part shows a comparison of the LV model in end-diastolic (colored opaquley blue) and end-systolic configuration (colored by displacement). Lower part shows comparison of clinical (colored blue) and simulated PV loops (colored red). The dashed orange curve shows the ideal Klotz curve, while the green curve shows the simulated Klotz curve, with volume of stress-free unloaded configuration marked as V0.

