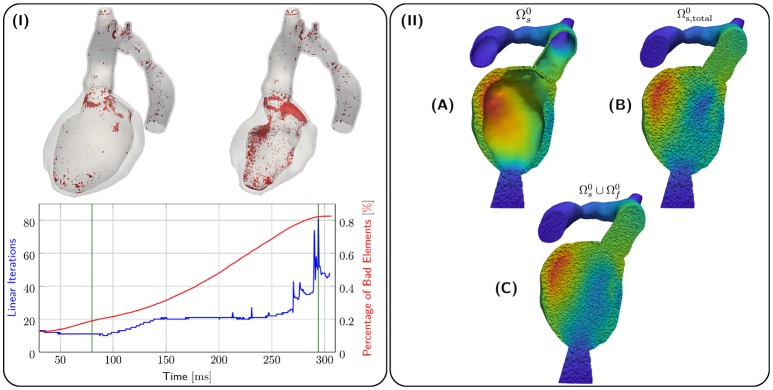
Figure 6.
(I) shows quality analysis for case 28-Pre. Spatial locations of elements of poor quality > 0.8 (in red) are shown at the top for different snapshots of deformation (green lines in graph). The graph below shows linear iterations per time step (in blue) and percentage of elements with poor quality > 0.8 (in red). (II) shows the processing stages of kinematic transfer for the 28-Pre case at maximum displacement. (A) Displacement ds on EM mesh . (B) Displacement ds extended to conformal EM blood pool mesh which serves as hanging background mesh for the kinematic transfer onto the CFD blood pool mesh . (C) Displacement ds on superimposed with fluid mesh displacement df on .

