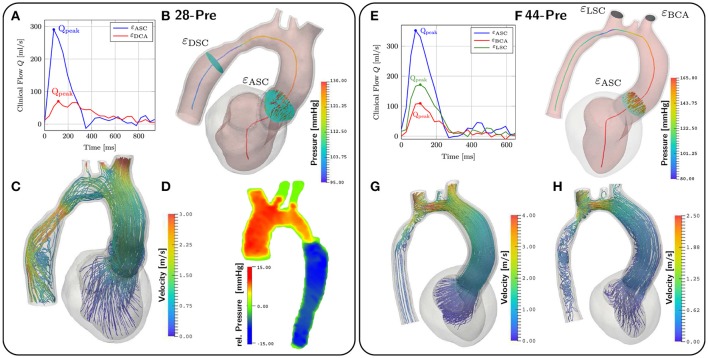
Figure 8.
CFD results. (A,E) show the given clinical measurements for flow through different planes. The planes are depicted in (B,F). (B,F) also depict the pressure along the centerlines at peak flow conditions at t = 167ms and t = 142ms respectively. (C) shows velocity streamlines at peak flow. (D) shows the relative pressure map from the Pressure–Poisson mapping used for validating the pressure drop in our simulations. (G,H) show velocity streamlines at peak flow and t = 200ms for case 44-Pre.

