Figure 2.
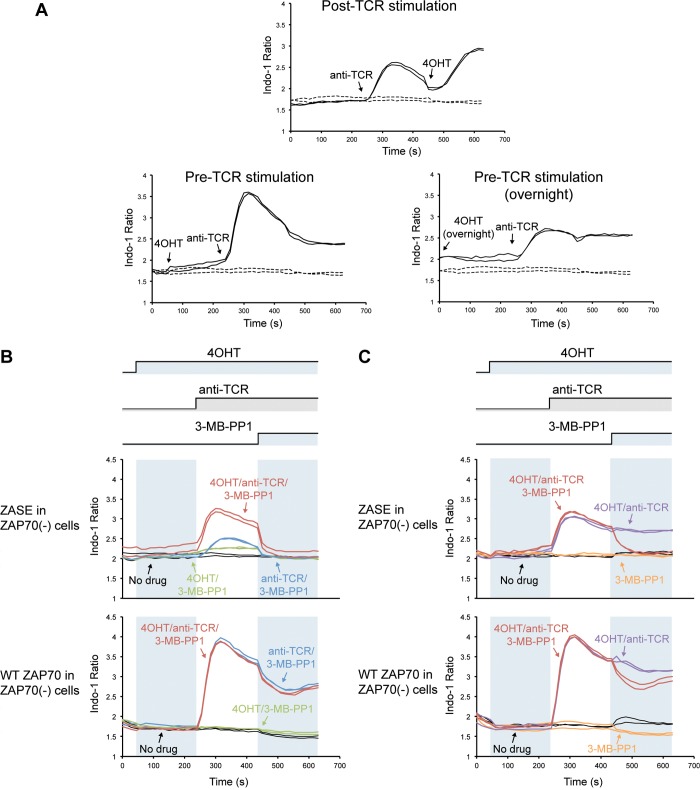
Calcium dynamics under varying small molecule conditions. (A) Intracellular calcium levels of ZASE-expressing P116 cells, with 4OHT added at different time points relative to stimulation of TCR. Control cells with no 4OHT or anti-TCR antibody are repeated in each panel for comparison with basal calcium levels. (B) Activation controls for cells expressing ZASE or wild-type ZAP70. Cells were treated with or without 4OHT, and with or without anti-TCR antibody. All cells were then inhibited with 3-MB-PP1. (C) Inhibition controls for cells expressing ZASE or wild-type ZAP70. Cells were treated with or without activation drugs, and with or without 3-MB-PP1.

