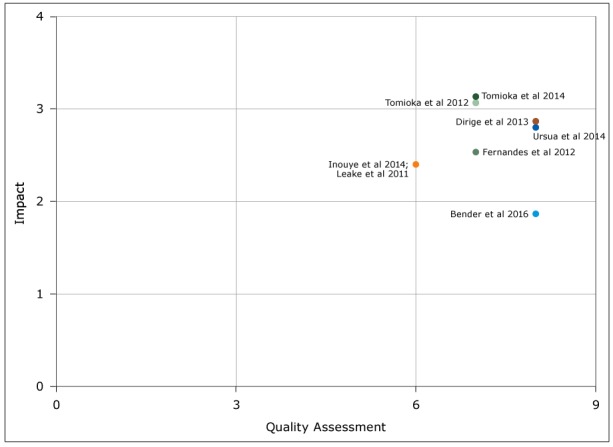
Figure 2.

Graph of intervention efficacy according to the Spencer grid (21), review of articles on increasing Filipino Amercian participation in cardiovascular disease prevention programs, United States, 2004–2016. The quality assessment score is the total number of quality criteria of 9 total that were met by the study (<5 = limited quality, 5–7 = fair quality, 8–9 = good quality). The total impact score is the mean of effectiveness, reach, feasibility, sustainability, and transferability scores for the intervention (<2 = low impact, 2–3 = moderate impact, >3 = high impact).
