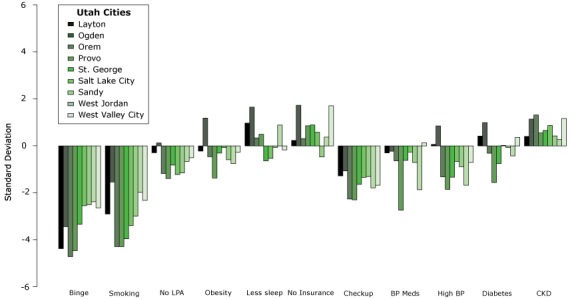
Figure 2.

Variability of kidney disease–related factorsa in Utah cities compared with other cities in the United States.
| Utah City | Binge | Smoking | No Leisure-Time Physical Activity | Obesity | Less Sleep | No Insurance | Check-up | Blood Pressure Meds | High Blood Pressure | Diabetes | Chronic Kidney Disease |
|---|---|---|---|---|---|---|---|---|---|---|---|
| Layton | −4.41 | −2.93 | −0.30 | −0.22 | 0.98 | 0.23 | −1.29 | −0.30 | 0.06 | 0.42 | 0.40 |
| Ogden | −3.47 | −1.56 | 0.12 | 1.19 | 1.66 | 1.74 | −1.07 | −0.23 | 0.86 | 1.00 | 1.15 |
| Orem | −4.75 | −4.32 | −1.19 | −0.47 | 0.34 | 0.31 | −2.28 | −0.65 | −1.33 | −0.31 | 1.33 |
| Provo | −4.50 | −4.33 | −1.40 | −1.38 | 0.50 | 0.86 | −2.32 | −2.76 | −1.86 | −1.57 | 0.55 |
| St. George | −3.36 | −3.99 | −0.83 | −0.31 | −0.64 | 0.90 | −1.65 | −0.62 | −1.35 | −0.76 | 0.66 |
| Salt Lake City | −2.56 | −3.42 | −1.23 | −0.07 | −0.54 | 0.58 | −1.36 | −0.27 | −0.67 | 0.02 | 0.87 |
| Sandy | −2.52 | −3.01 | −1.16 | −0.60 | −0.07 | −0.48 | −1.32 | −0.72 | −0.89 | −0.07 | 0.43 |
| West Jordan | −2.40 | −2.00 | −0.66 | −0.76 | 0.89 | 0.38 | −1.80 | −1.89 | −1.69 | −0.43 | 0.27 |
| West Valley City | −2.66 | −2.34 | −0.51 | −0.27 | −0.18 | 1.72 | −1.69 | 0.14 | −0.71 | 0.36 | 1.18 |
