. 2018 May 31;15:E70. doi: 10.5888/pcd15.170224

Figure.

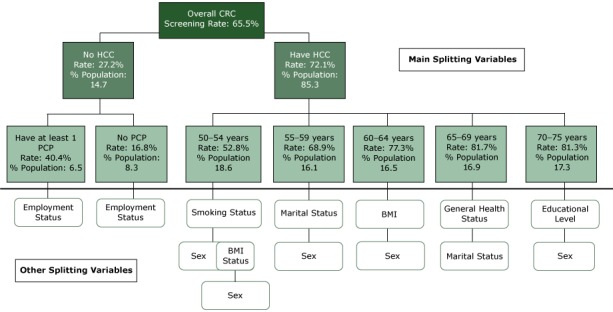
The tree is split into variables that are listed above a horizontal line of demarcation and those listed below it. The largest branch of the tree has 5 levels and shows the main splitting variables. The primary splitting variables and their associated nodes and statistics are shown above the horizontal demarcation line. The other splitting variables are shown below the line. The higher the splitting variables are on the tree, the stronger they are in predicting screening. The initial splitting variable, which is the parent node for which all subsequent subgroups were formed, was having HCC (yes, no). Among the uninsured population, the next splitting variable was having a PCP (yes, at least 1; no). In the insured group, the next split was by age (50–54 y, 55–59 y, 60–64 y, 65–69 y, 70–75 y). Variable splitting continued below the demarcation line until the least significant variable in the analysis (sex) was reached. The first splitting variables after the line of demarcation were smoking status (split into sex and BMI, which ended with sex); marital status, which was followed by sex; BMI, which was followed by sex); general health status , which was followed by marital status; and educational level, which was followed by sex).

Classification tree diagram for up-to-date status for CRC screening among adults aged 50 to 75 years, Florida Behavioral Risk Factor Surveillance System, 2013. Abbreviations: % Population, % of total weighted sample size in each node; BMI, body mass index; CRC, colorectal cancer; HCC, health care coverage; PCP, primary care provider.