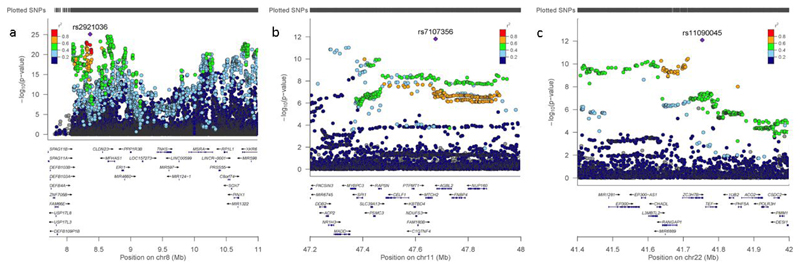
Figure 2.
Regional association plot for suggestive/significant signals in UK Biobank on a) chromosome 8p (site of the inversion polymorphism), b) chromosome 11, and c) chromosome 22. The SNP association p-value is shown on the y-axis and the SNP position (with gene annotation) appears on the x-axis; for each SNP, the strength of LD with the lead SNP is colour coded based on its r2. Plots were produced in LocusZoom.

