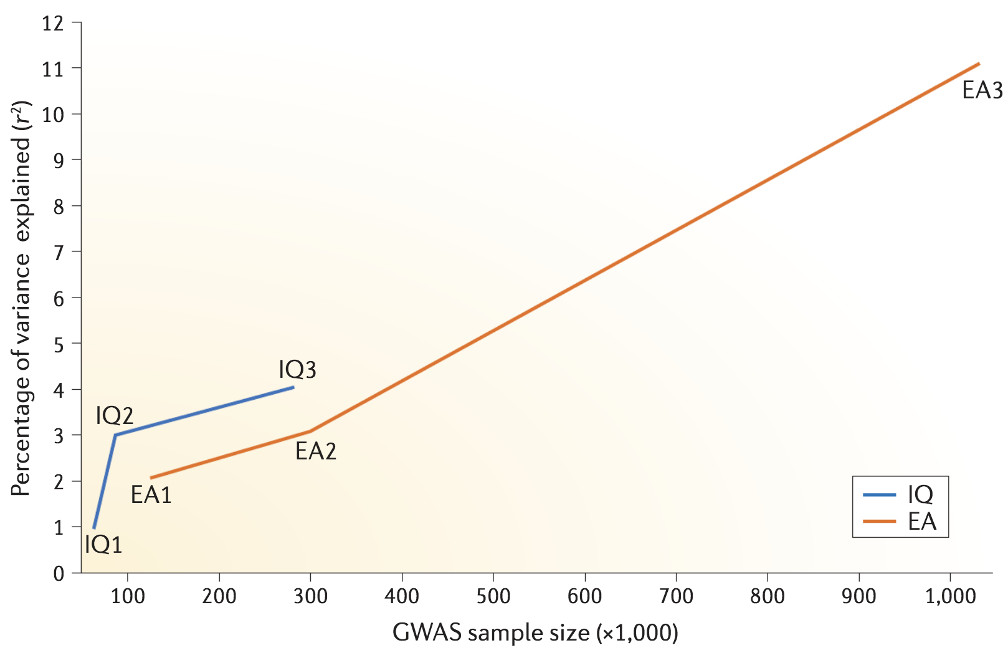
Figure 1. Variance explained by IQ GPS and by EA GPS in their target traits as a function of GWAS sample size.

GPS prediction of intelligence and educational attainment has increased linearly with sample size. The predictive power of GPS derived from GWAS of intelligence has risen in the last 2 years from 1% to 4%. The latest EA3 GPS predicts more than 10% of the variance in intelligence (P. D. Koellinger, personal communication), more than twice as much as the latest IQ3 GPS. Extrapolating from the results of EA3 with a sample size of over one million, we predict that more than 10% of the variance in intelligence will be predicted from an IQ GPS derived from a GWAS of intelligence with a sample size of one million. IQ122: n = 54,000, r2 = 0.01. IQ232: n = 78,000, r2 = 0.03. IQ333: n = 280,000, r2 = 0.04. EA128: n = 125,000, r2 = 0.02. EA230: n = 294,000, r2 = 0.03. EA3: n = 1,100,000, r2 > 0.10.
