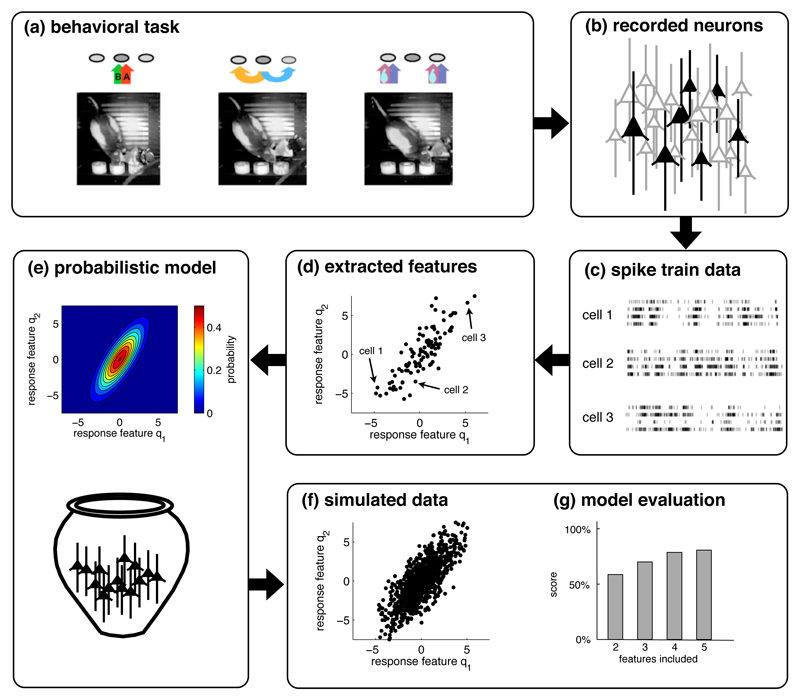
Figure 1. The statistical approach to population responses.
(a) We assume that data are recorded from awake behaving animals engaged in simple tasks. (Figure adapted from Feierstein et al. 2006). (b) The spike trains of a small subset of neurons in one area are recorded. (c) Recordings are sorted by trials over identical conditions. (d) For each neuron, we extract certain features from the spike trains, e.g., the stimulus-dependence of the firing rate or of the change in firing rate. (e) The distribution of these features across the recorded population leads to a probabilistic model of the population response. Such a model is usually generative, so that we can simulate data by randomly drawing neurons from the model (f), here depicted as an urn. (g) The simulated data should ideally be similar to the original data. This similarity is then quantified to evaluate the probabilistic model.

