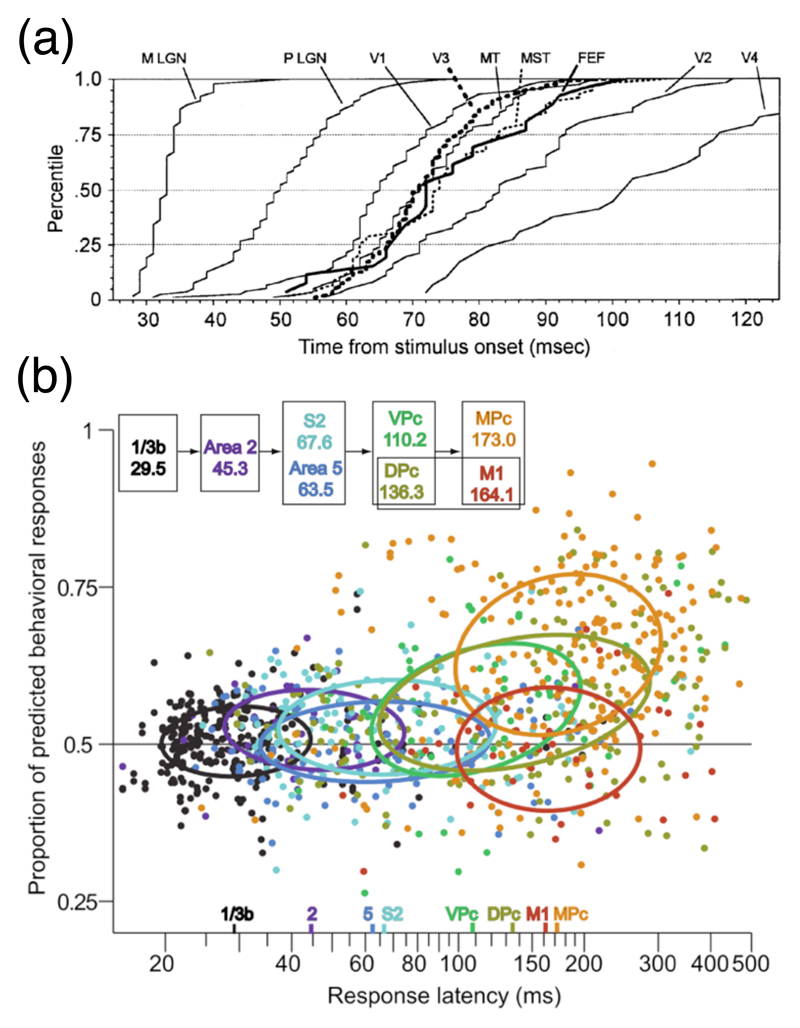
Figure 10. Distribution of response latencies across cortical areas.
(a) Cumulative distributions of (minimum) response latencies in several areas of the visual system of anaesthetized monkeys. Taken from (Schmolesky et al., 1998). (b) Latencies and choice probabilities in different areas involved in a tactile discrimination task. Latencies and choice probabilities increase along the putative processing pathway of information. Taken from (de Lafuente and Romo, 2006).

