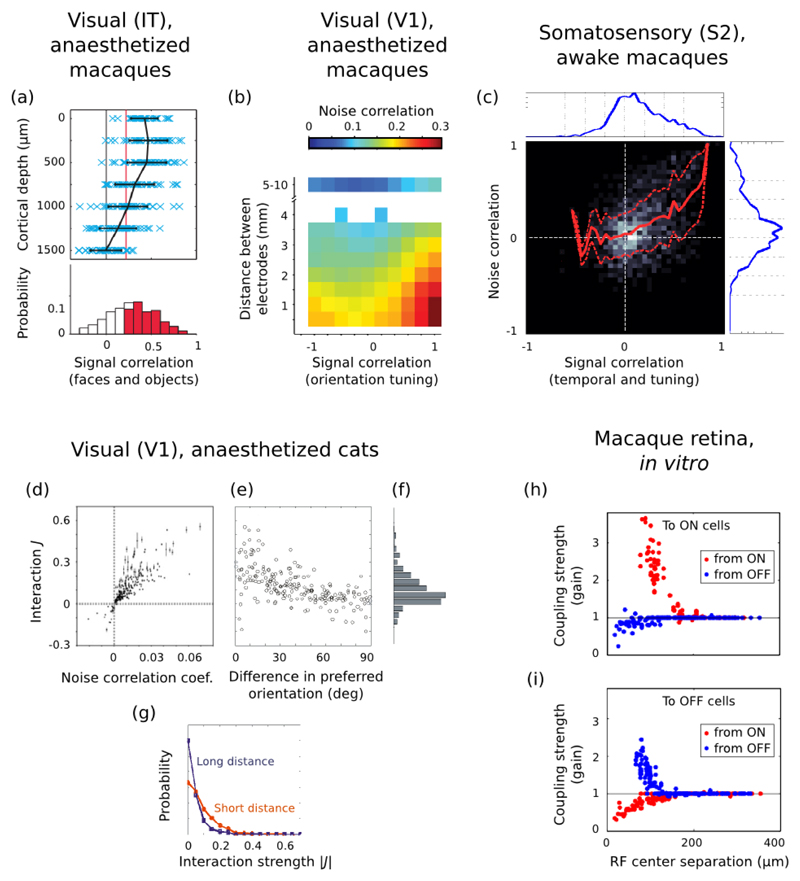
Figure 14. Population distributions of correlations.
(a) Distribution of signal correlations in IT neurons responding to various visual objects. Each blue cross depicts a pair of recording sites at the same cortical depth (ordinate), with the abscissa encoding signal correlation strength (similarity of tuning to a set of 60 objects) between multiunit activities at the two sites. The black curve and bars are mean and standard deviation of pairwise tuning similarity. The red line is the p = 0.05 significance threshold. The clear dependency between cortical depth and signal correlations is the mark of “activity spots”, whose neurons have broadly similar tuning and which are located mostly in the upper layers of cortex. Taken from (Sato et al., 2009). (b) Average pairwise noise correlation strength in macaque V1, plotted as a function of distance and tuning similarity (orientation) between the recorded neurons (Smith and Kohn, 2008). (c) Joint population distribution of signal correlation and noise correlation coefficients between pairs of neurons in secondary somatosensory cortex of macaques during a tactile discrimination task. The signal correlation between two neurons is computed as the overall similarity of their trial-averaged firing rates across time and stimuli (as in (Wohrer et al., 2010)). Blue histograms on the sides are marginalized distributions. Red curves represent conditional mean and standard deviation of noise correlation value at a given level of signal correlation. The width of the standard deviation plays an active role in estimating the overall sensitivity to stimulus in the population. Adapted from (Wohrer et al., 2010), a re-analysis of data from (Hernández et al., 2010). (d)-(g) Statistics of coupling strengths in an Ising model fit to cat V1 neurons. Coupling strengths relate, but are not equivalent, to classical noise correlation coefficients (panel d). Coupling is higher for similarly tuned neurons (orientation, panel e) and for nearby neurons (panel g). Taken from (Yu et al., 2008). (h)-(i) Statistics of coupling strengths in a Generalized Linear Model fit to retinal ganglion cell activity. On and Off cells are mostly interacting through mutual inhibition, whereas cells of the same polarity are positively coupled. Mean coupling strength decreases with interneuronal distance. Taken from (Pillow et al., 2008).

