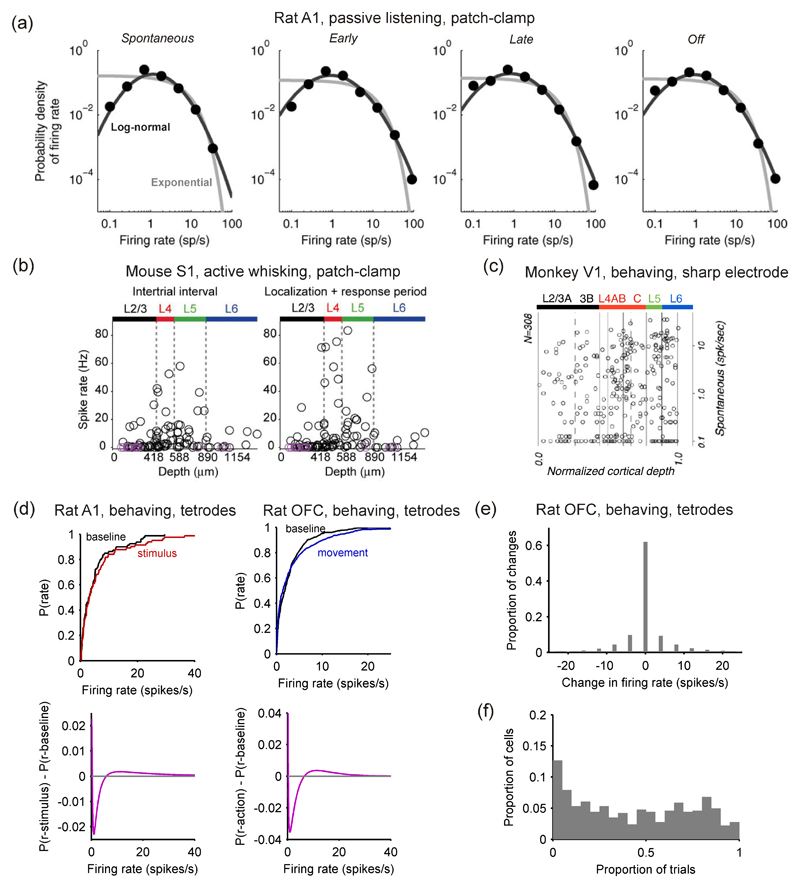
Figure 4. Evoked changes from baseline firing-rate distributions are small.
(a) Distribution of spike counts across neurons in the auditory cortex (A1) of awake rats responding to a pure tone pip. Activity distributions are shown before (‘spontaneous’), during (‘early’, ‘late’) and after (‘offset’) the tone pip. Best model fits are provided, using respectively an exponential (gray) and a log-normal (black) distribution. The log-normal provides a markedly better fit. Loose patch clamp recordings, from Hromadka et al. (2008a). (b) Distribution of spike counts in the layers of barrel cortex (S1) of awake mice involved in a tactile detection task. The mean level of activity is plotted for each neuron against its cortical depth, both during (‘localization+response’) and between (‘intertrials’) periods of whisker contact with the stimulus. Loose patch clamp recordings from O’Connor et al. (2010). (c) Distribution of firing rates for spontaneous (baseline) activity in each layer of area V1 of monkeys observing a uniform-luminance screen; note firing rates are plotted on a log-scale (single extracellular micro-electrode recordings; adapted from Ringach et al., 2002). (d) Changes in mean firing rate distributions for two data-sets from Figure 3: stimulus-evoked changes in A1 (tetrodes; data from Otazu et al. 2009), and movement-evoked changes in OFC (tetrodes; data from Feierstein et al. 2006). Top: the empirical cumulative probability distributions for the baseline (‘spontaneous’) and task-aligned firing rates. Bottom: difference in probability distribution functions for the best-fitting models to spontaneous activity, p(r – baseline), stimulus-evoked activity, p(r – stimulus), or action-related activity, p(r – action) (the models are given in Figure 3b), showing the smooth extent of the increase in higher firing rates in both A1 and OFC. (e) From rat OFC data (Feierstein et al., 2006), the distribution of rate changes between baseline and movement for every sampled firing rate (every neuron in every trial): no change occurred between baseline and movement in 62.1% of samples. (f) From rat OFC data (Feierstein et al., 2006), the distribution of the proportion of trials on which each neuron showed a difference in rate between baseline and movement; median proportion was 0.42.

