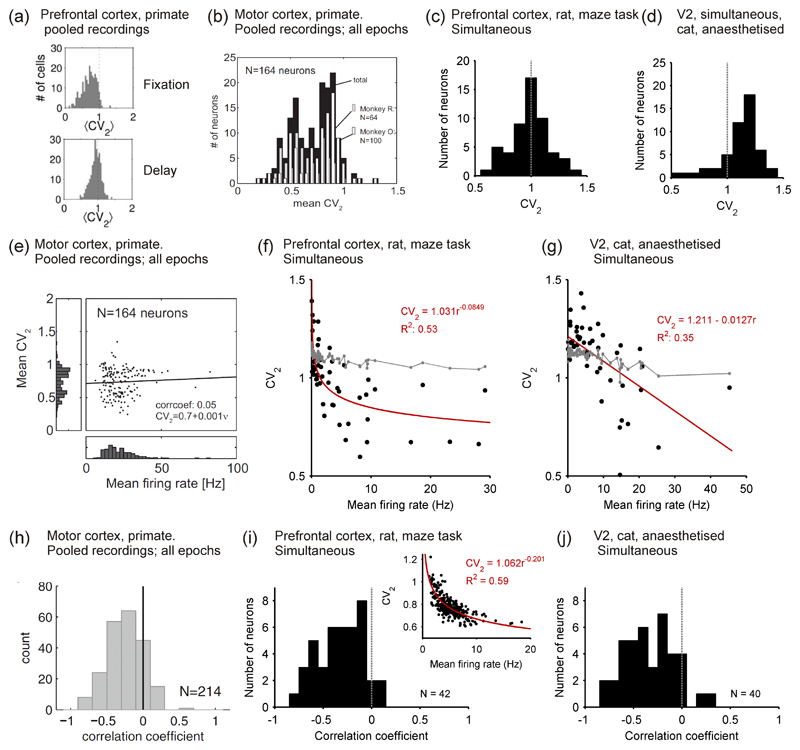
Figure 5. Distributions of spike train regularity in cortex.
(a) Distributions of rate-invariant irregularity measure CV2 in primate PFC during the fixation (top) and delay (bottom) period of an oculomotor task; neurons pooled over multiple single-unit recordings. Taken from Compte et al. (2003). (b) Distribution of CV2 in primate motor cortex, averaged over all task stages; neurons pooled over multiple single-unit recordings. Taken from (Hamaguchi et al., 2011). (c) Distribution of CV2 in a single tetrode recording from awake rat PFC. Data from study of (Peyrache et al., 2009). (d) Distribution of CV2 in a single polytrode recording from anaesthetised cat V2. Data recorded by Tim Blanche (see Blanche et al., 2005), available from crcns.org. (e) Correlation between mean firing rate and CV2 in primate motor cortex, calculated over all task stages. Note the lack of data-points below 10 Hz. Taken from (Hamaguchi et al., 2011). (f) Correlation between mean firing rate and CV2 in a single recording from awake rat PFC; data: black symbols; best-fit model: red line. The grey symbols and lines give the predicted relationship if each spike-train was a rate-varying Poisson process: each point is the mean predicted CV2 for a spike-train of that mean rate; 95% confidence intervals are too small to see on this scale. Data from study of (Peyrache et al., 2009). (g) Correlation between mean firing rate and CV2 in a single polytrode recording from anaesthetised cat V2. Grey lines and symbols as in panel e. Data recorded by Tim Blanche (see Blanche et al., 2005), available from crcns.org. (h) Distribution of coefficients r for the correlation between rate and CV2 for each neuron in a data-set of single-unit extracellular recordings from primate motor cortex during a joystick task. Taken from (Ponce-Alvarez et al., 2010). (i) Distribution of coeefficients r for the correlation between rate and CV2 for a population of neurons simultaneously recorded in awake rat PFC; the inset shows an example neuron that had a power-law relationship between rate and CV2. Data from study of (Peyrache et al., 2009). (j) Distribution of coecients r for the correlation between rate and CV2 for a population of neurons simultaneously recorded in anaesthetised cat V2. Data recorded by Tim Blanche (see Blanche et al., 2005), available from crcns.org.

