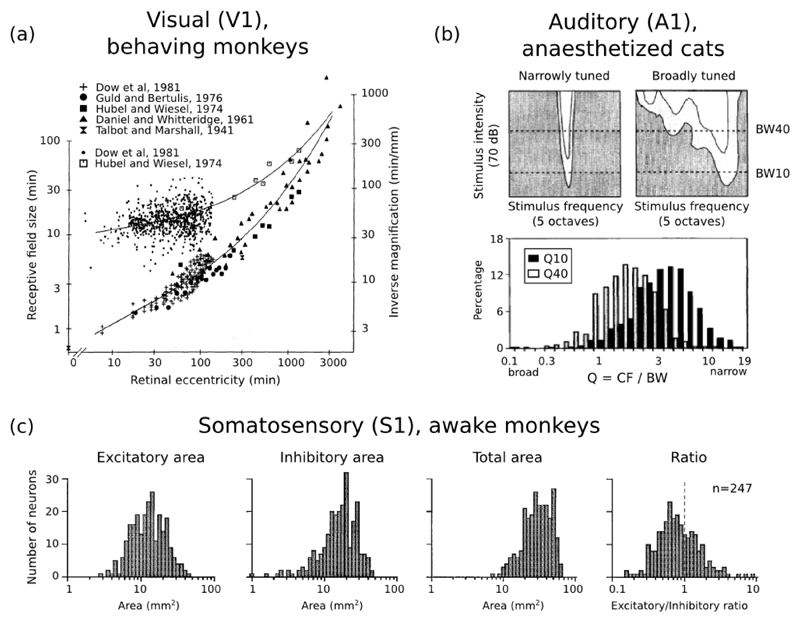
Figure 6. Cortical receptive fields sizes are broadly distributed.
(a) Distribution of receptive field sizes (top curve, left ordinates) and inverse cortical magnification (bottom curve, right ordinates) in monkey V1 neurons as a function of retinal eccentricity; from Dow et al. (1981). (b) Top panels: sample responses of A1 neurons to pure tones, as a function of tone frequency, and intensity (measured in dB above the neuron’s threshold of response). Bottom panel: distribution of relative response bandwidths (best frequency divided by bandwidth) in cat A1 neurons, at respectively 10 dB and 40 dB above threshold; from Schreiner et al. (2000). (c) Distribution of receptive field sizes in monkey S1 neurons from the distal digit pads. From left to right, population histograms are shown for the excitatory subfields, inhibitory subfields, full receptive fields, and for the exc/inh ratio of areas; from DiCarlo et al. (1998).

