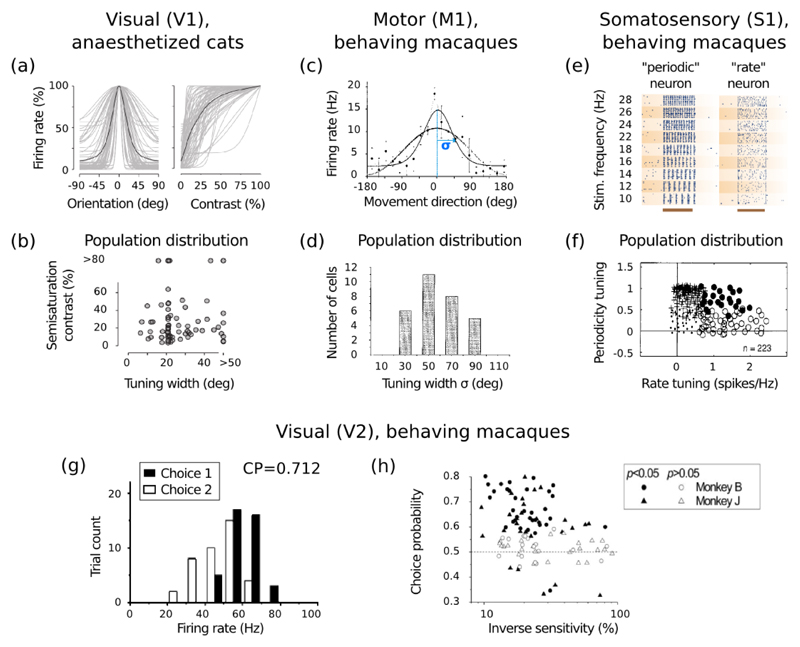
Figure 8. Population-wide distributions of tuning parameters provide qualitative hints about the nature of feature encoding in different areas.
(a) Population response of V1 neurons to oriented gratings (anaesthetized cats, multi-unit electrode array). Left: Single neuron tuning curves to grating orientation. Right: Single neuron responses as a function of grating contrast. (b) Population distribution of two tuning features, namely sharpness of orientation tuning and contrast sensitivity, from the data in (a). Taken from (Busse et al., 2009). (c) Example of a “sharp” tuning curve for arm movement in primate M1 cortex. Symbols: the neuron’s mean firing rate as a function of the angular distance from the neuron’s preferred direction (at 0°). Black line: best-fit of a von Mises function; grey line: approximate fit of the classic cosine tuning curve for comparison. (d) Distribution of tuning curve width in primate M1 cortex, taken as the half-width of the von Mises function (blue lines in panel e). A half-width of σ = 90° is the cosine tuning curve assumed in (Georgopoulos et al., 1982). Taken from (Amirikian et al., 2000). (e) Population response of S1 neurons to vibratory stimulation on the fingertip (awake macaques, multi-electrode recordings). S1 neurons can display tuned responses to the vibration frequency, either through conservation of the stimulus periodicity (“periodic” neuron), or through their overall amount of firing (“rate” neuron). (f) Joint distribution of these two forms of tuning across recorded S1 neurons. Rate tuning is not correlated with periodic tuning, supporting a plausible specific role of the former in tactile perception. Taken from (Hernández et al., 2000). (g) Trial-to-trial distributions of activity for an MT cell conditioned on the animal’s subsequent decision, when the stimulus is ambiguous (0% binocular disparity). Choice probability quantifies the amount of separation between the two distributions. (h) Choice probability and neuronal sensitivity are correlated at the population level, indicating that the animal’s ultimate decision correlates more with neurons tuned to the stimulus. Macaque MT during a binocular discrimination task, taken from (Uka and DeAngelis, 2004).

