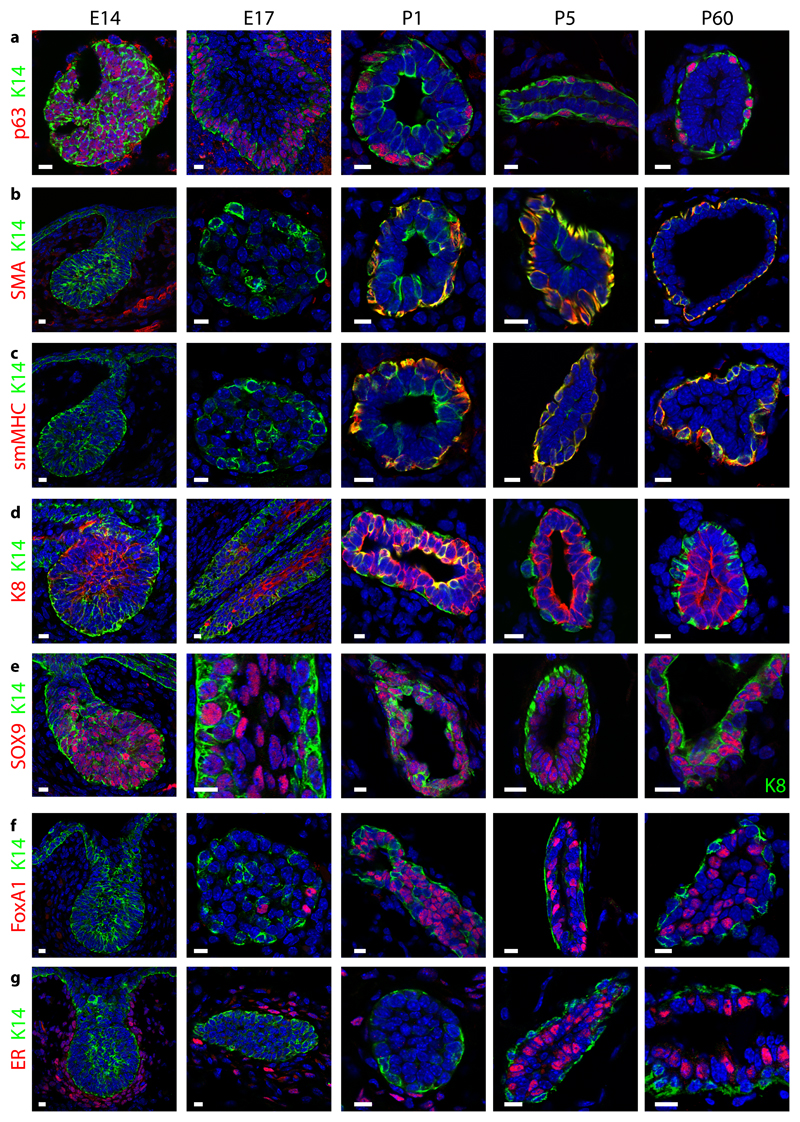
Figure 5. Asymmetrical expression of basal and luminal markers marks the early step of MG lineage segregation.
Confocal imaging of immunostaining of K14 and p63 (a), SMA (b), smMHC (c), K8 (d), Sox9 (e), FoxA1 (f) and ER (g) in E14, E17, P1, P5 and P60 MG shows the temporality of cellular heterogeneity during MG development (except in e where the MG at P60 is represented with K8 staining). Representative images from 3 independent mice analysed per time point. Scale bars, 10 μm.

