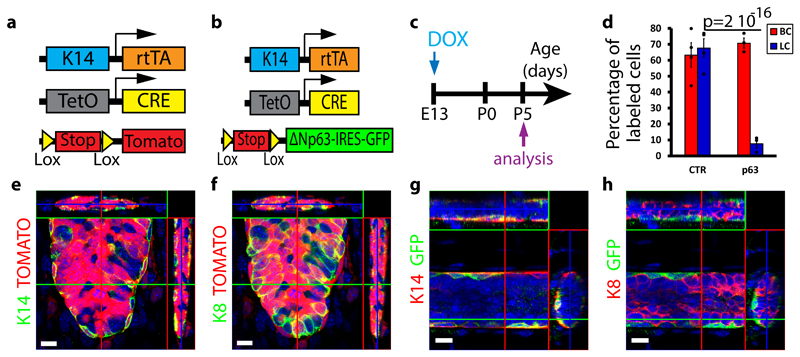
Figure 6. p63 promotes unipotent BC fate in EMPs.
a-b, Scheme summarizing the genetic strategy used to target tdTomato (a) or ΔNp63-IRES-GFP (b) expression in K14-expressing cells at E13. c, Scheme summarizing the protocol used to study the fate of cells targeted during embryogenesis using K14rtTA/TetO-Cre/Rosa-tdTomato or Rosa-ΔNp63-IRES-GFP mice. d, Graph representing the mean percentage of labelled BCs and LCs in control versus p63-overexpressing mice. Respectively n=4 and n=3 independent mice were analysed in K14rtTA/TetO-Cre/Rosa-tdTomato and in Rosa-ΔNp63-IRES-GFP mice. Individual data points are represented as dots. Error bars, s.e.m. P-value derived from Fisher exact test without adjustment. See Supplementary Table 1 for source data related to d. e-f, Confocal imaging of immunostaining of K14 (e) or K8 (f) and Tomato in K14rtTA/TetO-Cre/Rosa-tdTomato mice induced at E13 with 15μg/g of DOX. Representative images from 4 mice analysed. g-h, Confocal imaging of immunostaining of K14 (g) or K8 (h) and GFP in K14rtTA/TetO-Cre/Rosa-ΔNp63-IRES-GFP mice induced at E13 with 15μg/g of DOX. Representative images from 3 mice analysed. e-h represent orthogonal projections of 3D stacks. Scale bars, 10 μm.

