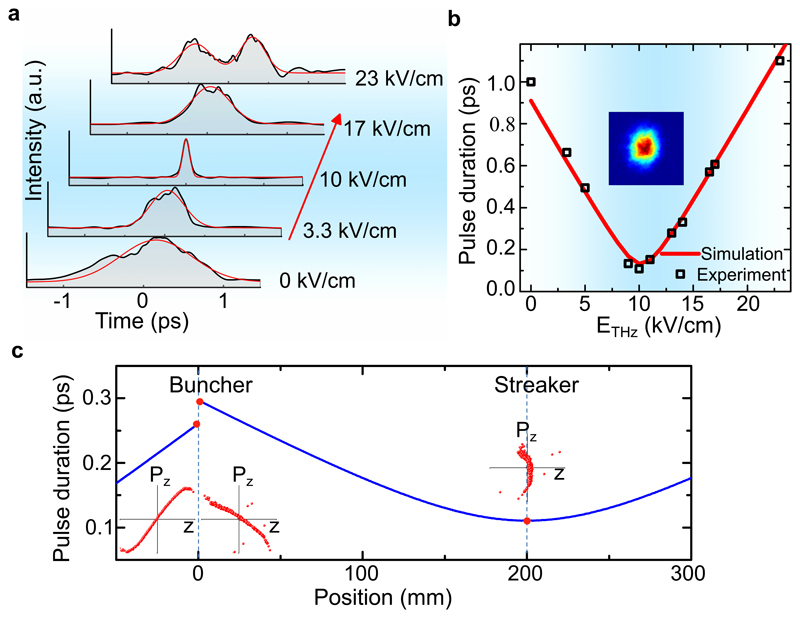
Fig. 4. Terahertz-driven electron pulse compression.
a, Measured temporal profiles of the electron pulses as the THz field in the buncher is increased (red arrow). The red lines represent Gaussian fits. b, Black squares: measured electron bunch FWHM duration versus incident THz field strength. Red line: corresponding simulation results. Inset: the electron beam spatial profile on the detector at the optimal compressed condition. c, Simulated bunch length vs position. Inset: longitudinal phase-space distribution before the rebunching cavity, after the rebunching cavity and maximally compressed position marked with red dots respectively. This demonstration was performed with the Yb:KYW laser using one STEAM-device as a rebunching cavity and one as electron streak camera with a bunch charge of ~1 fC.

