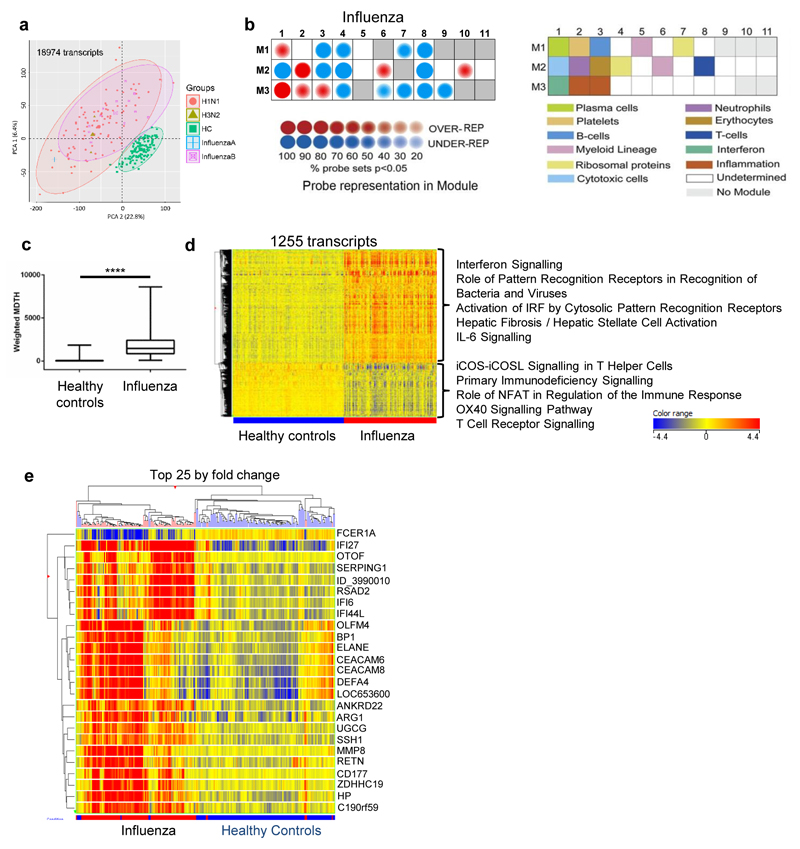
Figure 1. Transcriptional signature of influenza compared to healthy controls.
(a) Principal component analysis of all transcripts significantly above background in at least 10% of samples (130 healthy controls (green squares), 97 influenza A (red circles: H1N1; green triangles, H3N2), and 12 influenza B (purple squares); all from 2010/11). (b) Modular analysis of 2010/11 influenza patients relative to healthy controls. The expression of the modules is shown on the left according to the colour intensity display; the corresponding modules are identified in the key to the right. (c) Weighted ‘molecular distance to health’ (MDTH24) of 2010/11 influenza patients compared to healthy controls, undertaken on 4526 transcripts that were significantly detected above background, filtered for low expression (transcripts retained if >2 fold-change (FC) from median normalised intensity value in more than 10% of all samples). Box whisker plot with min/max lines; statistical test: Mann-Whitney P<0.0001. (d) Heat-map of 1255 normalised intensity value transcripts, filtered for low expression then statistically filtered (Mann-Whitney with Bonferroni multiple testing correction P<0.01) followed by fold change filter between groups (transcripts retained if >2FC between any 2 groups). Listed next to the heat-map are the top five IPA canonical pathways (by significance; P<0.05, Fisher’s Exact test) for upregulated and downregulated transcripts. (e) Heat-map of normalised intensity values of the top 25 significant transcripts by mean fold-change between healthy controls and influenza groups clustered on entities and by individuals (Pearson’s uncentered (cosine) with averaged linkage).

