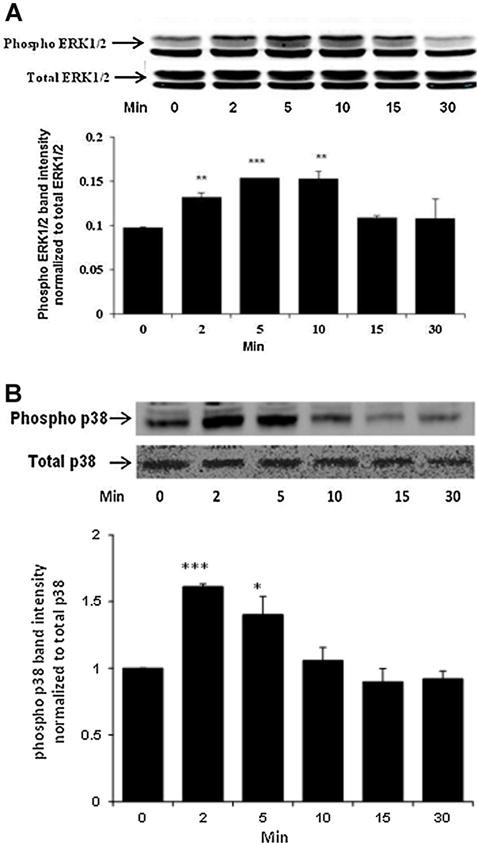
Fig. 11.

Western blot showing time-dependent phosphorylation of ERK1/2 (Part A) and p38 MAPK (Part B) in NPE cells treated with 100 μM SNP for 2–30 min. In each part, a typical Western blot for the time-dependent response (upper) together with a bar graph (lower) showing band density results (mean ± SEM), pooled from three independent experiments, are presented. *P < 0.05, **P < 0.01, and ***P < 0.001 indicate significant differences from control.
