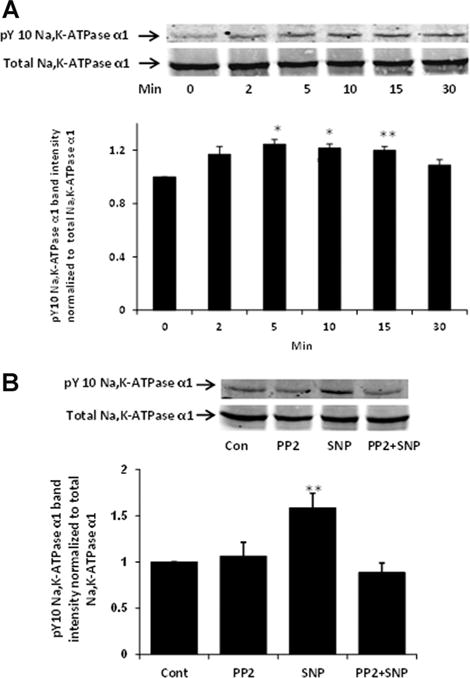
Fig. 4.

Western blots showing tyrosine phosphorylation of Na,K-ATPase α1 catalytic subunit in cells treated with SNP (100 μM) (Part A). A typical time course is presented alongside a bar graph that shows band density results pooled from three independent experiments (mean ± SEM). Part B shows the influence of PP2 on SNP-induced tyrosine phosphorylation of the Na,K-ATPase α1 subunit. Western blot analysis was performed on samples obtained by homogenizing cells that had been pre-incubated with PP2 (10 μM) for 40 min before being exposed to SNP (100 μM) for 10 min in the continued presence of PP2. A typical Western blot of pY-10-Na,K-ATPase-α1 bands (upper) and total Na,K-ATPase α1 subunit bands (lower) detected simultaneously in the same samples alongside a bar graph (lower) that shows pY-10-Na,K-ATPase-α1 band density normalized to total Na,K-ATPase α1 (mean ± SEM) of three independent samples, are presented. *P < 0.05, **P < 0.01, and ***P < 0.001 indicate significant differences from control.
