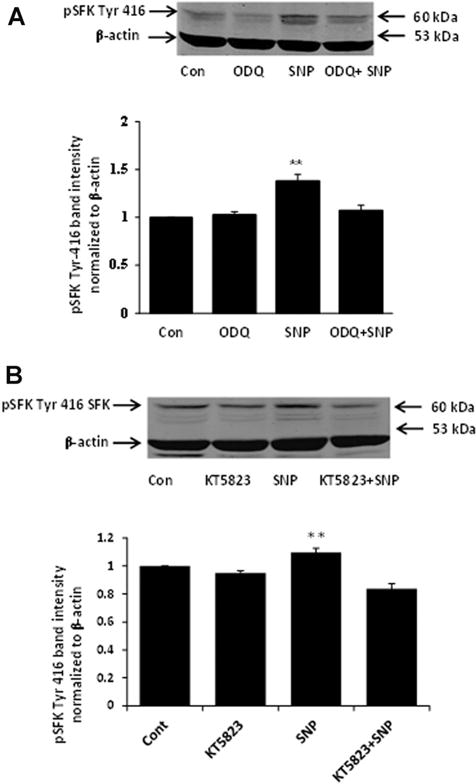
Fig. 9.

Western blots showing the inhibitory effect of ODQ (Part A) and KT5823 (Part B) on SFK phosphorylation in cells treated with 100 μM SNP. The samples were obtained from cells that had been pre-incubated with ODQ (10 μM) or KT5823 (1 μM) for 20 min before being exposed to SNP for 10 min in the continued presence of either ODQ or KT5823. Each part shows a typical Western blot (upper) together with a bar graph (lower) of pSFK Tyr 416 band density normalized to β-actin (mean ± SEM), pooled from three independent experiments. **Indicates a significant difference from control, P < 0.01.
