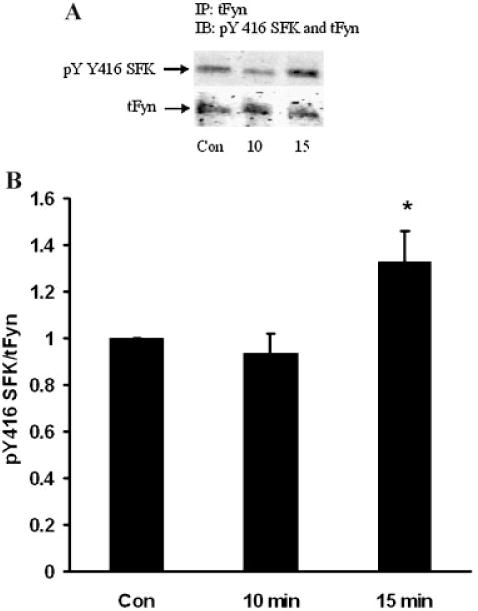
Fig. 9.

Part A: A Western blot showing pY416 SFK-immunoreactive band density of Fyn kinase isolated by immunoprecipitation from the epithelium of intact lenses that had been incubated for 0 (Control), 10 or 15 min in the presence of ET-1 (100 nM). As a loading control, total Fyn protein (tFyn) immunoreactive band density was measured in the same blot. Part B: Pooled data on pY416 SFK band density relative to tFyn band density. The values are the mean ± SE of results from three independent experiments. *P < 0.05 indicates a significant difference from control.
