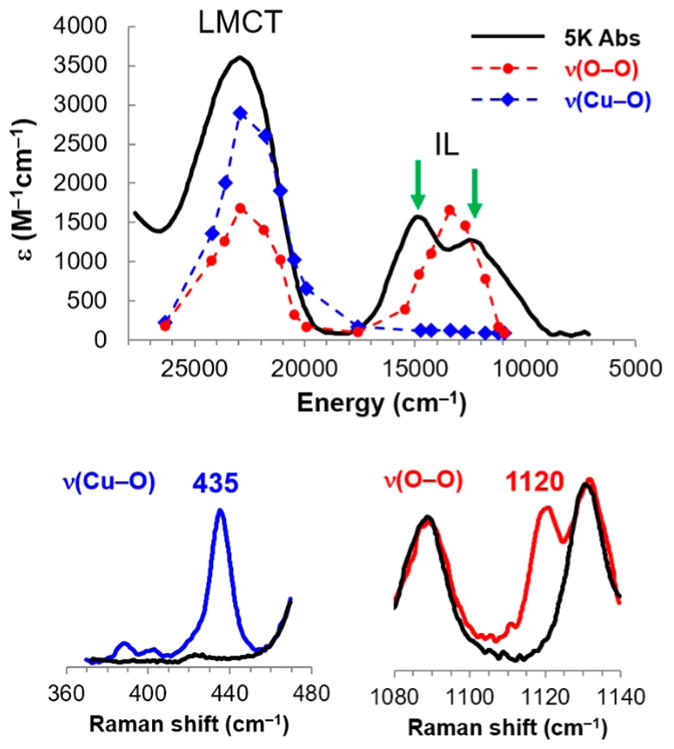
Figure 8.

Electronic structure of TMG3tren CuO2−. Top: Absorption spectrum (black) and resonance Raman excitation profiles in the O–O stretch (red, spectrum at bottom right) and Cu–O2− stretch (blue, bottom left). Note that the two peaks indicated by arrows in the absorption spectrum in the IL region are ligand field transitions. (See ref 32 for detailed assignments using MCD spectroscopy.)
