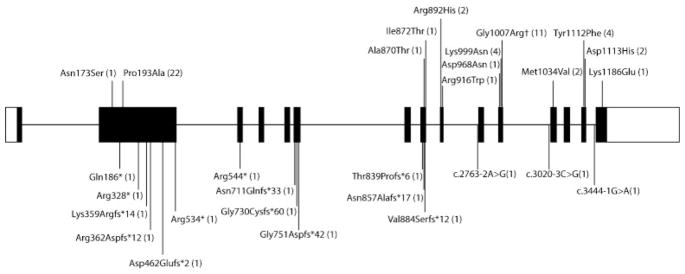
Fig. 1.
Schematic of ADAR1 gene showing mutations (according to protein nomenclature) ascertained in the present study. Missense and nonsense mutations are annotated above and below, respectively. Numbers in brackets indicate the number of families in which each mutation was observed. †Indicates mutation acting as a dominant negative.

