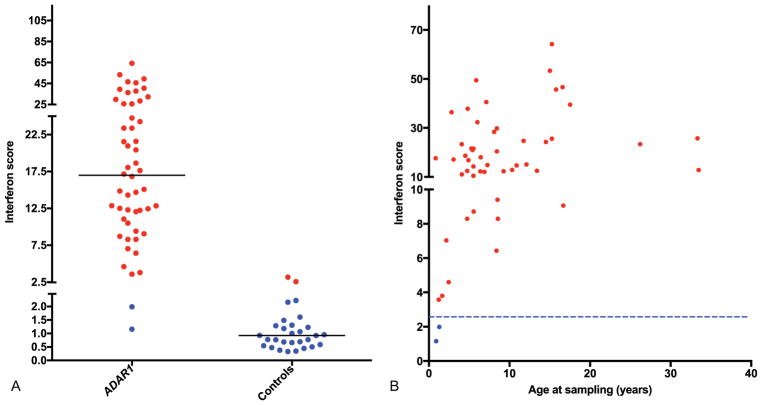
Fig. 4.
Interferon score data in ADAR1-mutated patients and controls. Summary of interferon score data (A) in ADAR1-mutated patients and controls and (B) in ADAR1-mutated patients by age. Circles indicate results above +2 SD of the mean of 29 controls (= 2.466, considered “positive”). Solid horizontal lines indicate median value of ADAR1-mutated and control groups. Dotted line indicates positive/negative boundary (2.466) of interferon score.

