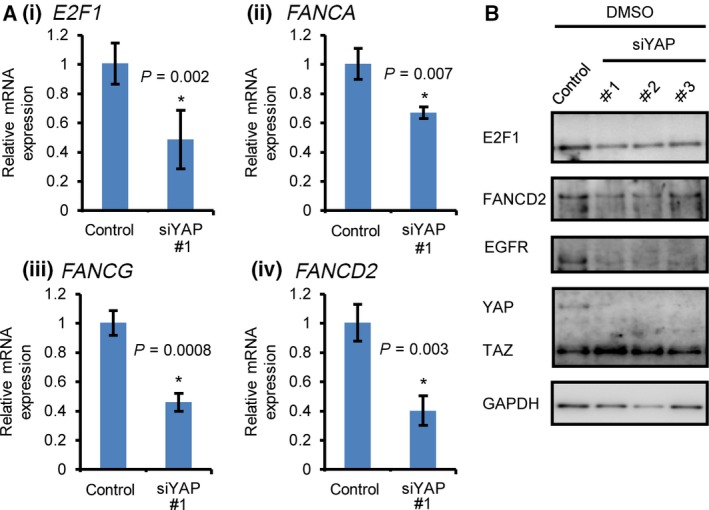
Figure 4.

Reduced expression of the FA complex components and their transcriptional regulator E2F1 by YAP inactivation. (A) mRNA was quantified using qPCR 3 days post‐siRNA transfection. RPSL13A was used as a control. The data represent the mean and standard deviation of triplicates. The data are representative of at least three independent experiments. Significant differences between the groups were evaluated using an independent‐sample t‐test. *P < 0.05. (B) YAP was depleted using siRNA and treated with AZD1775 and gemcitabine for 4 days. Data are representative of at least two independent experiments.
