Fig. 3.

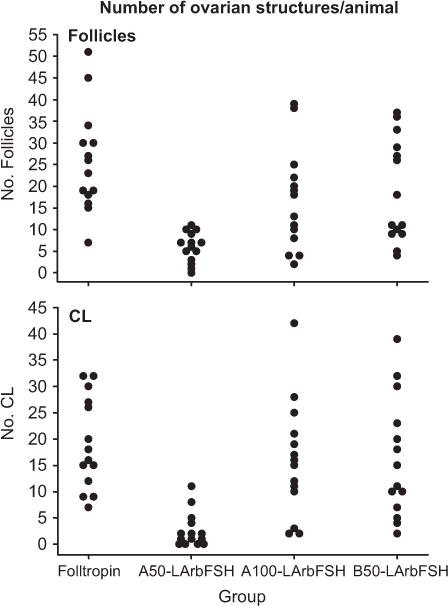
Scatter plot distributions of the number of ovulatory follicles measured immediately before induction of ovulation and the number of CL measured 7 days later and immediately before embryo collection (upper and lower panel, respectively).

Scatter plot distributions of the number of ovulatory follicles measured immediately before induction of ovulation and the number of CL measured 7 days later and immediately before embryo collection (upper and lower panel, respectively).