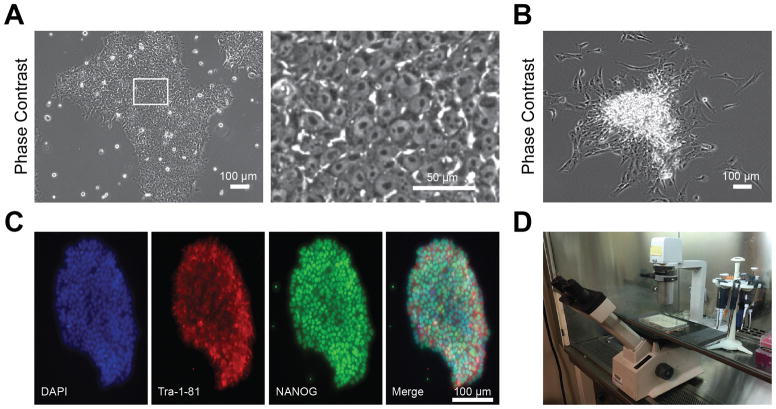
Figure 3.
Generation, characterization, and isolation of optimal hiPSCs from blood using Sendai virus reprogramming. A) Phase contrast images illustrating optimal hiPSC morphology following reprogramming. Note how hiPSCs are tightly packed into a colony. Inset depicts high magnification image, showing individual hiPSCs with characteristic large nuclei and small amounts of cytoplasm per cell. B) Phase contrast image illustrating suboptimal hiPSC morphology. Note how hiPSCs are spontaneously differentiating at the edges of the colony. C) Immunofluorescence staining for standard hiPSC markers including Tra-1-81 and NANOG. Optimal hiPSCs should express pluripotent stem cell markers such as these. D) Example microscope setup for hiPSC clone isolation. Microscope should be placed within a sterile cell culture hood.

