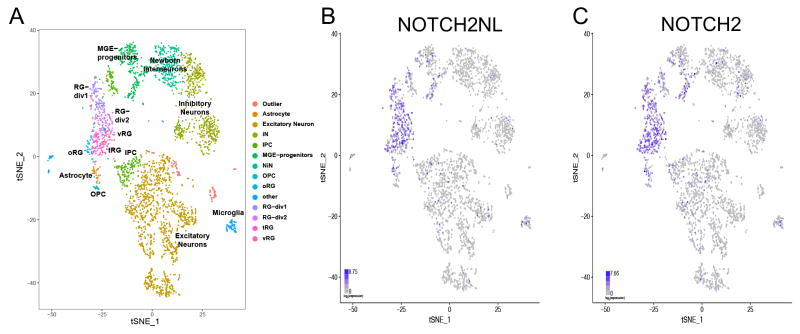
Figure 3. Radial glia-specific expression of NOTCH2NL in human fetal brain samples.
Scatterplot of 3466 fetal brain cells after single cell RNA-Seq principal components analysis and t-stochastic neighbor embedding (tSNE) as described in Nowakowski, et al., 2017. Cells are colored by annotated cell type clusters (A), NOTCH2NL expression (B) and NOTCH2 expression (C). See also Figure S3.

