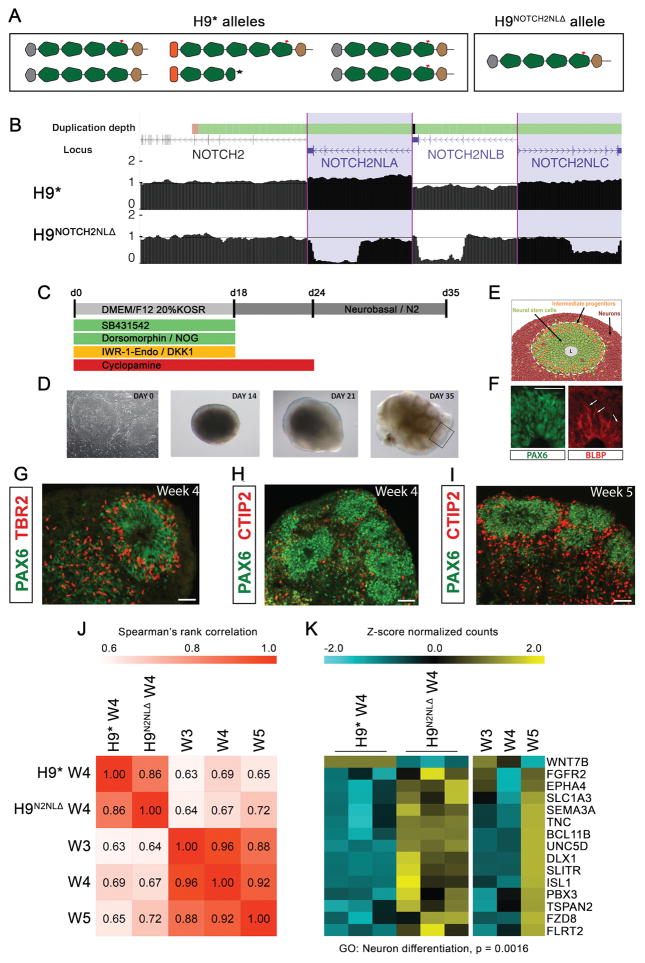
Figure 5. Cortical organoids from hESCs lacking NOTCH2NL show premature neuronal maturation.
(A,B) Schematic of NOTCH2NL alleles (A) and UCSC genome browser view of NOTCH2 and NOTCH2NL loci showing normalized genome sequencing coverage (B) in control (H9*) and NOTCH2NL mutant (H9NOTCH2NLΔ) cell lines. Cortical organoid protocol schematic (C) with bright field images (D) and cell types generated (E). (F–I) Immunofluorescence staining of cortical organoids with markers of radial glia (PAX6, BLBP), intermediate progenitors (TBR2) and layer V cortical neurons (CTIP2). Scale bar=50 μm. (J) Spearman’s rank correlation using the top 250 upregulated and downregulated genes (H9NOTCH2NLΔ / H9*), and data from previously generated W3, W4 and W5 H9 organoids. (K) Heatmap showing expression for a selection of genes in the significantly enriched GO cluster ‘neuron differentiation’. See also Figure S5 and Table S2.

