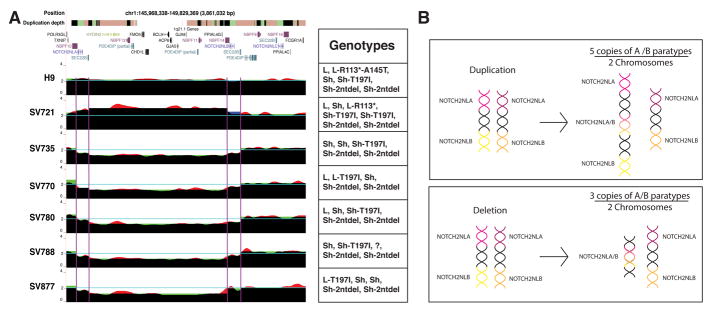
Figure 7. Patients with 1q21.1 Distal Deletion/Duplication Syndrome show breakpoints and CNV in NOTCH2NLA and NOTCH2NLB.
(A) UCSC Genome Browser screenshot from GRCh38. The duplication depth track indicates duplicated genome sequences as colored bars: white (single copy, N=1), orange (N=2–4), green (N=5), black (N>5). DNA sequence coverage tracks were generated in three ways. (1) Normalized read depth was calculated based on the entire region (red) or (2) by segmenting into 5 subregions: centromeric to NOTCH2NLA, NOTCH2NLA, between NOTCH2NLA and NOTCH2NLB, NOTCH2NLB, and telomeric to NOTCH2NLB (green) (STAR Methods). (3) Average coverage for breakpoints within NOTCH2NLA and NOTCH2NLB is shown as step function (blue). Where all models agree, the colors combine to black. (B) Schematic of the NOTCH2NL chromosomal configuration before and after a duplication or deletion event. See also Figure S7, Table S3–S4.

