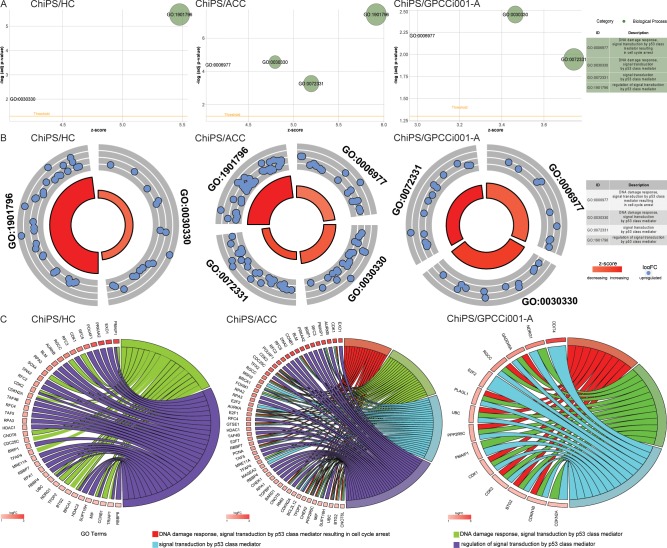
Fig 4. Bubble plots of significantly-enriched GO terms for the experimental groups: ChiPS vs HC-402-05a (HC), articular cartilage chondrocytes (ACC), and GPCCi001-A related to DNA damage repair (DDR) mechanisms activated during chondrogenic differentiation.
These activated mechanisms were as follows “DDR signal transduction by p53 class mediator resulting in cell cycle arrest”; “DDR signal transduction by p53 class mediator”; “signal transduction by p53 class mediator” and “regulation of signal transduction by p53 class mediator”. The negative logarithm of the adjusted p-values from all analysed GO terms are shown on the y-axes, while the z-score values are given on the x-axes (A). The circular scatter plots show the differentially expressed genes involved in specific GO terms. The logarithm of the fold change value (logFC) of differentially expressed genes is shown (B). Circos plots show the interdependence between selected GO terms and their genes. Genes are situated on the left side of the graph and indicated by their symbols and ordered by logFC values (C).

