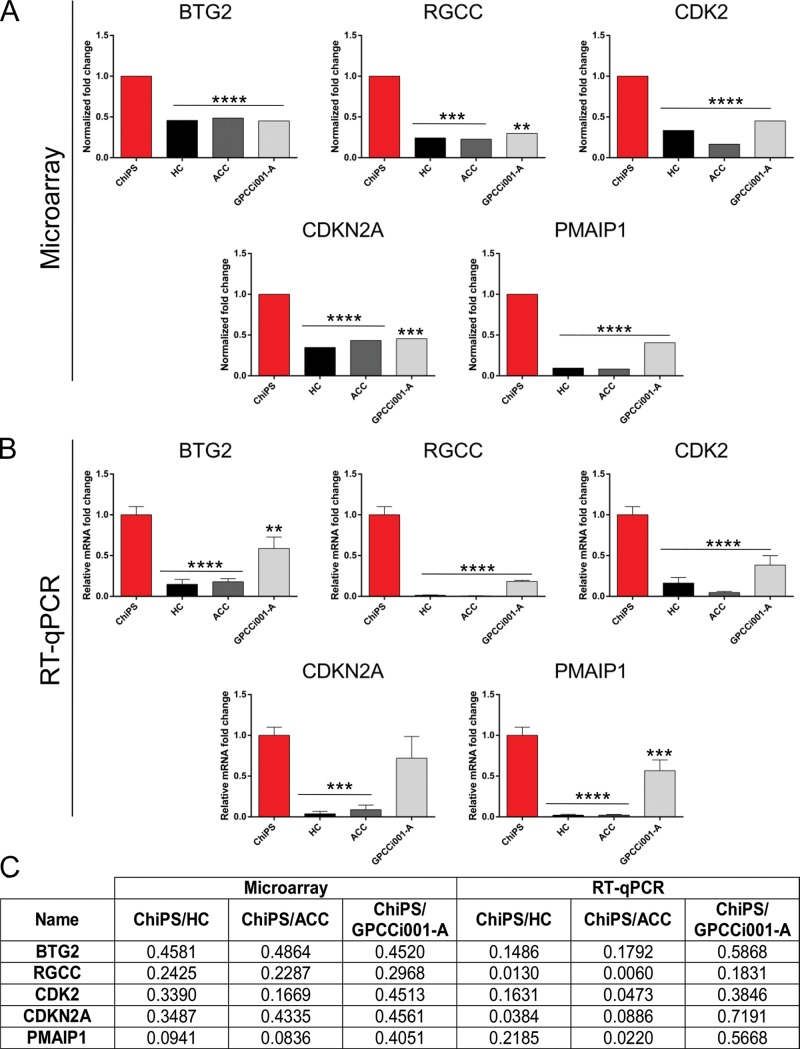
Fig 6. Real time qPCR validation of microarray data.
For the evaluation, we selected the most highly expressed genes involved in both DNA damage and p53 signalling pathways based on the previously created circos plot GO terms. The top panel represents normalized ChiPS fold changes (FC) of selected genes based on microarray data (A). The bottom panel represents microarray data assessed by RT-qPCR technique. The graph represents means ± SD from three replicates per group (B). The table shows normalized FC and p-values of selected genes from the microarray and RT-qPCR analyses (C).

