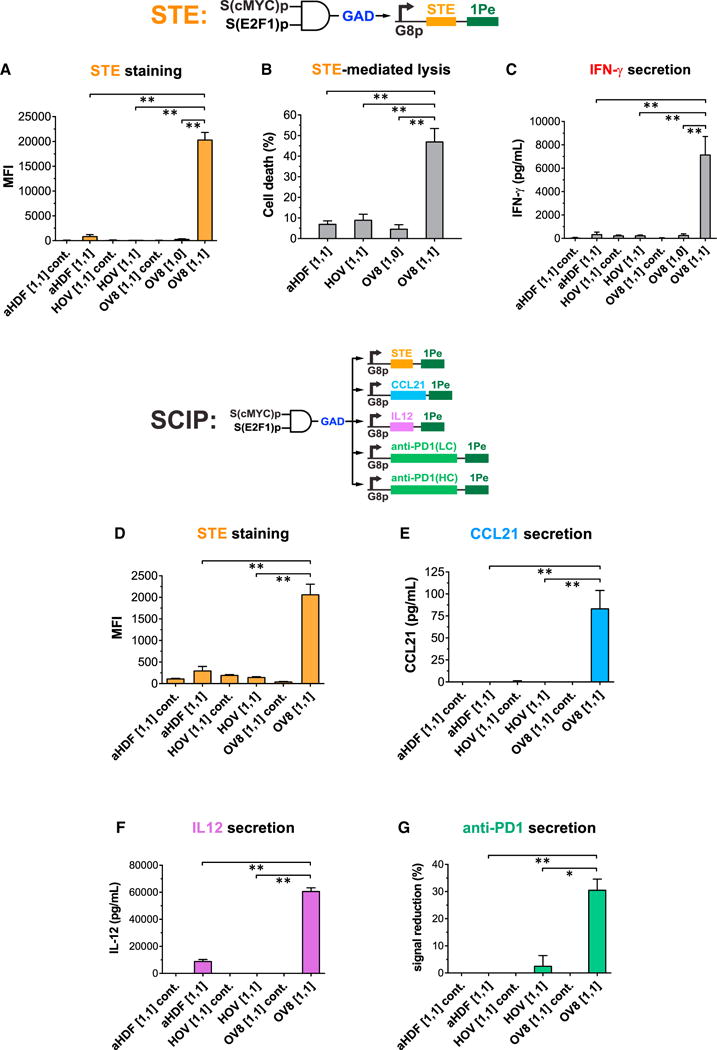
Figure 6. Synthetic Circuits Triggered Human Ovarian Cancer-Specific Expression of STE, T Cell-Mediated Lysis, and IFN-γ Secretion on Tumor Cells.

(A–C) The circuit in Figure 5A was engineered to display STE on cell surfaces as the output. STE was encoded in module 3. State “[1,1] cont.” indicates cells containing module 1 and module 2 and a negative control module 3con that expresses the non-specific transcription factor rtTA3 as the output. State [1,1] indicates cells containing module 1, module 2, and module 3. State [1,0] indicates cells containing module 1, a negative control module 2con in which S(E2F1)p expresses ECFP without miR1-BS(B), and module 3. Circuit-transduced tumor cells but not normal cells expressed high levels of STE in state [1,1], which triggered robust T cell killing and IFN-γ secretion. Student’s t test was performed to compare the [1,1] states between normal cells and OV8 cells, and the [1,1] state versus the [1,0] state in OV8 cells.
(D–G) Synthetic circuits triggered human ovarian cancer-specific expression of combinatorial immunomodulators. The circuit in Figure 5A was extended to express multiple immunomodulatory outputs (surface-displayed STE and secreted CCL21, IL12, and anti-PD1 Ab) specifically in OV8 cells but not normal primary cells. State [1,1] cont. indicates cells containing module 1 and module 2 and a negative control module 3con that expresses the non-specific TF rtTA3 as the output. State [1,1] indicates cells containing module 1, module 2, and module 3. Each immunomodulatory gene was expressed from its own G8p promoter encoded on a lentivirus, except for the anti-PD1 Ab, which was split into two lentiviruses encoding LC and HC respectively. Cell lines were co-infected with these lentiviral constructs. Student’s t test was performed to compare output levels in the [1,1] states between normal cells and OV8 cells.
Error bars represent SEM, n = 3 biological replicates (*p < 0.05; **p < 0.005).
See also Figure S4.
