Figure 2.
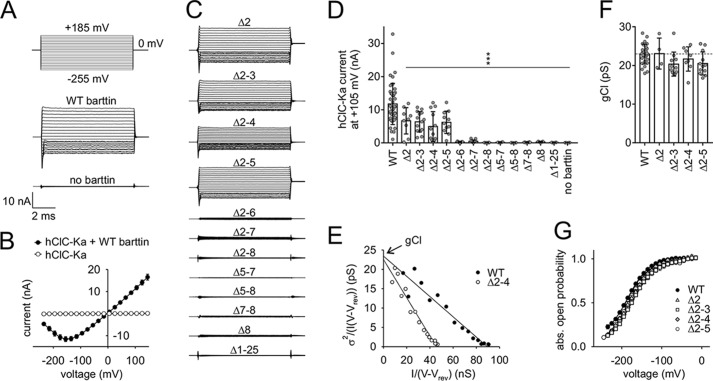
Mutations of the barttin N terminus reduce or even abolish hClC-Ka/barttin currents. A, voltage protocol and representative whole-cell patch-clamp current recordings from HEK293T cells expressing human hClC-Ka channels in the presence or absence of WT barttin. B, voltage dependence of the mean current amplitudes of hClC-Ka channels in the presence or absence of WT barttin. C, representative current recordings of hClC-Ka channels in the presence of mutant barttin (the same voltage protocol as in A). D, hClC-Ka current amplitudes at +105 mV in the presence of WT (reference condition) or mutant barttin (statistical significance tested by one-way ANOVA and Holm–Sidak post hoc test versus WT barttin: F(13, 135) = 15.6 and p < 0.001; WT, n = 44; Δ2, n = 9; Δ2–3, n = 14; Δ2–4, n = 12; Δ2–5, n = 11; Δ2–6, n = 7; Δ2–7, n = 15; Δ2–8, n = 6; Δ5–7, n = 4; Δ5–8, n = 6; Δ7–8, n = 8; Δ8, n = 5; Δ1–25, n = 4; no barttin, n = 4). E–G, stationary noise analysis of hClC-Ka/barttin currents. E, representative plot of the current variance (σ2), normalized to the product of the mean current (I) and the electrical driving force (V − Vrev) versus the macroscopic conductance (I/(V − Vrev)) for hClC-Ka in the presence of WT or Δ2–4 barttin. A linear fit provides the gCl (unitary pore conductance) as the y axis intercept and the number of conductive pores as the inverse slope. F, unitary pore conductances (gCl). The broken line represents the reference condition in the presence of WT barttin (statistical significance tested by one-way ANOVA and Holm–Sidak post hoc test versus WT barttin: F(4, 58) = 2.52 and p = 0.051; WT, n = 28; Δ2, n = 4; Δ2–3, n = 11; Δ2–4, n = 8; Δ2–5, n = 12). G, voltage dependence of absolute open probabilities of hClC-Ka/barttin channels (WT, n = 20; Δ2, n = 3; Δ2–3, n = 10; Δ2–4, n = 6; Δ2–5, n = 12). Error bars, S.E. in B and G, S.D. in D and F.

