
Figure 1.
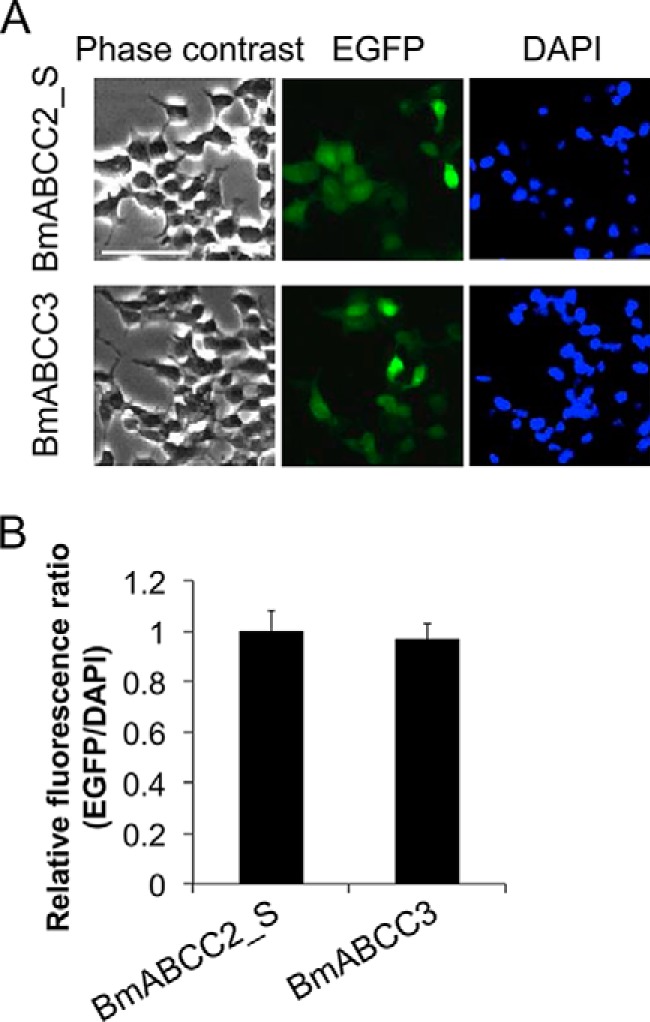
Expression levels of BmABCC2 and BmABCC3 in transfected HEK293T cells. A, HEK293T cells seeded on a 6-well plate were transfected with 2 μg of vector for 2 h. EGFP, which was fused to the C termini of the BmABCC3 mutants, and DAPI, which stains nuclear DNA, were visualized under a fluorescence microscope after 48 h, as described under “Experimental procedures.” Scale bar, 40 μm. B, the relative fluorescence ratio (GFP/DAPI) indicating the per-cell expression levels of BmABCC2_S or BmABCC3 was calculated using the fluorescence intensities from three fields of view, including images in Fig. S3. Error bars, S.E.