
Figure 4.
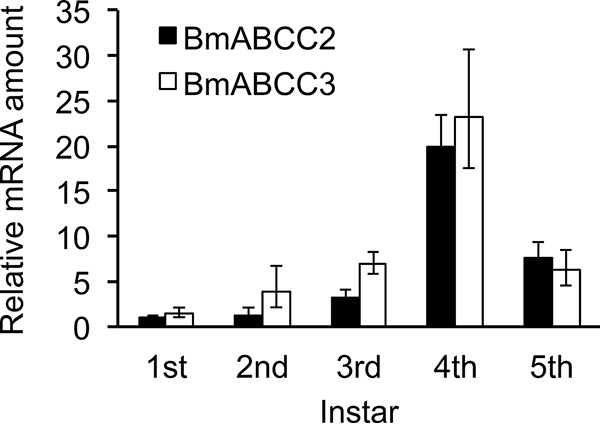
Expression levels of BmABCC2_S and BmABCC3 in midgut tissues from silkworm larvae by quantitative RT-PCR. The y axis shows the relative amount of mRNA, with the mRNA amount of BmABCC2_S in the first instar defined as 1. Midgut tissues were sampled from day 2 larvae from the first to fifth instars. Error bars, S.E. (n = 3).