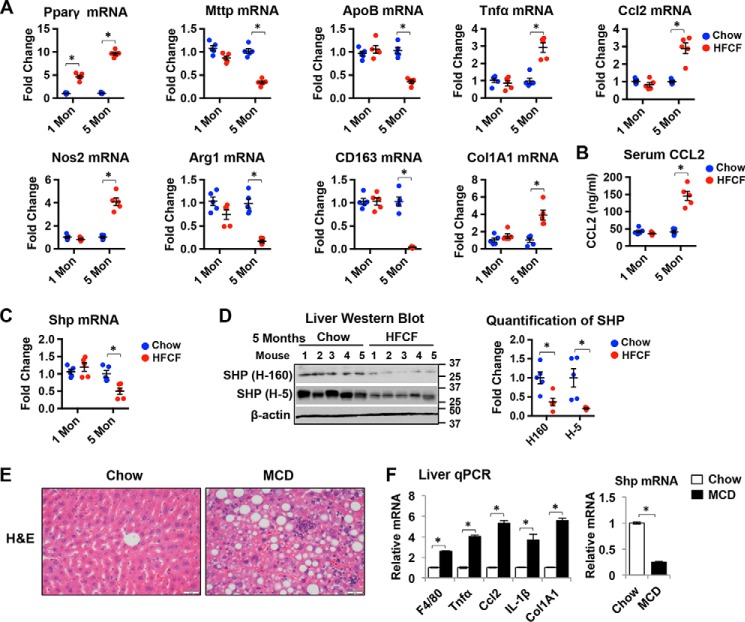
Figure 3.
SHP level is decreased in the livers of mice NASH. A, qPCR analysis of relative mRNA levels of genes related to lipid metabolism, inflammation, and fibrosis in the livers of mice fed chow or HFCF for 1 and 5 moths. n = 5 mice/group. *, p < 0.05 HFCF versus chow-fed. B, serum level of CCL2 was measured by ELISA. n = 5 mice/group. *, p < 0.05 HFCF versus chow-fed. C, qPCR analysis of Shp mRNA level in the livers of mice fed chow or HFCF. n = 5 mice/group. *, p < 0.05 HFCF versus chow-fed. D, left, Western blot analysis of SHP protein in the livers of mice fed chow or HFCF for 5 months. SHP H-160 is a rabbit polyclonal antibody and SHP H-5 is a mouse mAb. Both antibodies recognize the epitope corresponding to amino acid 1–160 mapping at the N terminus of SHP protein. Right, band intensities were calculated using ImageJ software. The level of SHP was normalized to the expression of loading control β-actin, and -fold changes relative to that of the controls are plotted. n = 5 mice/group. *, p < 0.05 HFCF versus chow-fed. E, representative images of liver sections stained with H&E in mice fed chow or MCD diet for 1 month. Original magnification, ×40. F, qPCR analysis of gene expression in the livers of mice fed chow or MCD diet for 1 month. n = 5 mice/group. Data are presented as mean ± S.D. *, p < 0.05 versus respective controls.

