Figure 5.
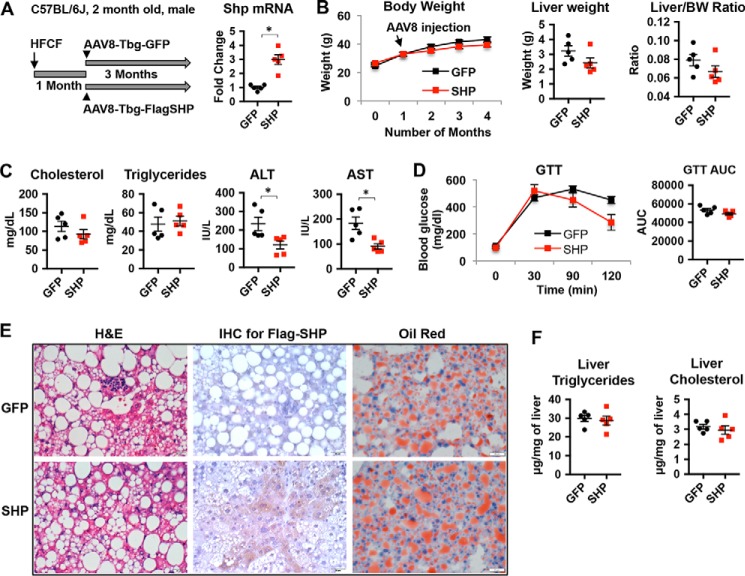
Increasing hepatocyte SHP levels in steatotic liver does not change liver steatosis. Two-month-old male C57BL/6J mice were fed a HFCF diet for 1 month to develop liver steatosis followed by tail vein administration of AAV8-Tbg-FlagSHP or control vector AAV8-Tbg-GFP. The mice remained on the HFCF diet for an additional 3 months. A, left, schematic diagram showing experimental design. Right, qPCR analysis of Shp mRNA levels in the liver. n = 5 mice/group. *, p < 0.05 SHP versus GFP. B, left, body weight change over time; middle, liver weight; right, liver weight to body weight ratio. n = 5 mice/group. C, serum levels of cholesterol, triglycerides, ALT, and AST. n = 5 mice/group. *, p < 0.05 SHP versus GFP. D, left, GTT. Right, the area under the curve (AUC) of GTT was calculated. n = 5 mice/group. E, representative images of liver sections stained with H&E, immunohistochemistry staining (IHC) of FLAG-SHP, and oil red O. Original magnification, ×40. n = 5 mice/group. F, liver triglycerides and cholesterol content. n = 5 mice/group.

