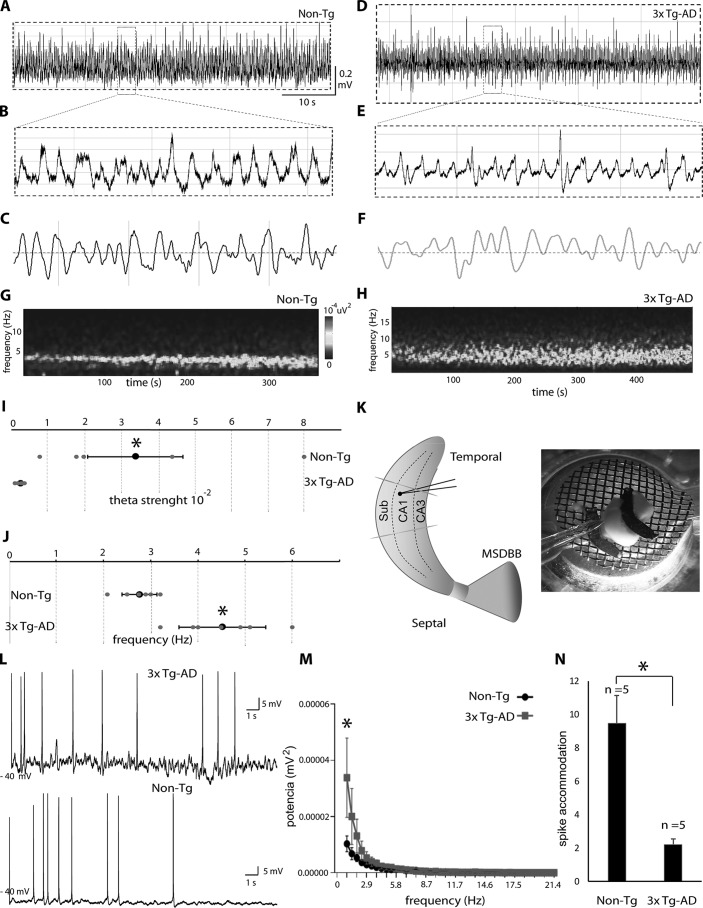
Figure 3.
Young 3xTg-AD mice were characterized by alterations in theta activity. A, representative traces of network oscillatory activity recorded in the CA1/subiculum area of non-Tg mice. B, theta band activity magnification of sample window from non-Tg mice. C, filtered traces at theta band frequency (3–8 Hz) from non-Tg mice. D, representative traces from theta activity recorded at CA1/subiculum of 3xTg-AD mice. E, theta band activity magnification of sample window from 3xTg-AD mice. F, filtered traces at theta band frequency (3–8 Hz) from 3xTg-AD mice. G and H, spectrograms (400 s) from the same recordings shown above (G and H, respectively). I, statistical analysis of theta oscillation strength confirmed lower values in the 3xTg-AD group when compared with the non-Tg group. J, statistics showed the increase in average oscillation frequency from the 3xTg-AD group when compared with the non-Tg group. K, micrograph and recording position in the septo-hippocampal preparation. L, comparison of subthreshold membrane oscillations and spike accommodation in 3xTg-AD and non-Tg group. M, graphic representation of subthreshold membrane oscillations in the 3xTg-AD group when compared with the non-Tg group. N, graphic representation of spike accommodation in the 3xTg-AD group when compared with the non-Tg group. All bar graphs show means ± S.E. *, p < 0.05.

